Immigrants from Korea vs Costa Rican Householder Income Over 65 years
COMPARE
Immigrants from Korea
Costa Rican
Householder Income Over 65 years
Householder Income Over 65 years Comparison
Immigrants from Korea
Costa Ricans
$70,696
HOUSEHOLDER INCOME OVER 65 YEARS
100.0/ 100
METRIC RATING
17th/ 347
METRIC RANK
$61,638
HOUSEHOLDER INCOME OVER 65 YEARS
66.9/ 100
METRIC RATING
153rd/ 347
METRIC RANK
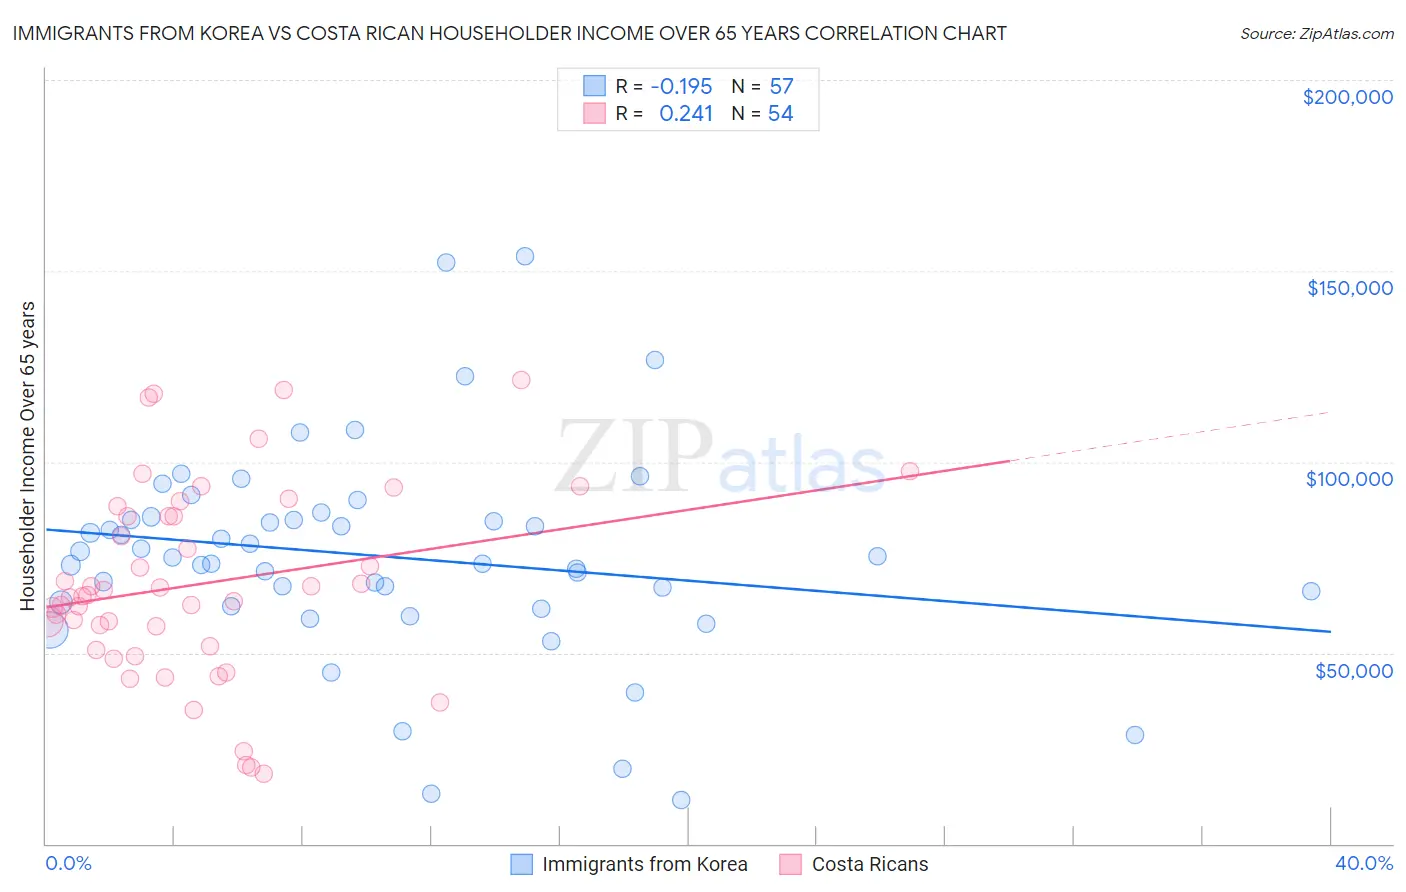
Immigrants from Korea vs Costa Rican Householder Income Over 65 years Correlation Chart
The statistical analysis conducted on geographies consisting of 414,435,632 people shows a poor negative correlation between the proportion of Immigrants from Korea and household income with householder over the age of 65 in the United States with a correlation coefficient (R) of -0.195 and weighted average of $70,696. Similarly, the statistical analysis conducted on geographies consisting of 253,120,412 people shows a weak positive correlation between the proportion of Costa Ricans and household income with householder over the age of 65 in the United States with a correlation coefficient (R) of 0.241 and weighted average of $61,638, a difference of 14.7%.
Householder Income Over 65 years Correlation Summary
| Measurement | Immigrants from Korea | Costa Rican |
| Minimum | $11,563 | $18,343 |
| Maximum | $153,930 | $121,538 |
| Range | $142,367 | $103,195 |
| Mean | $75,285 | $68,075 |
| Median | $74,994 | $64,957 |
| Interquartile 25% (IQ1) | $62,762 | $51,771 |
| Interquartile 75% (IQ3) | $85,219 | $85,791 |
| Interquartile Range (IQR) | $22,457 | $34,020 |
| Standard Deviation (Sample) | $27,458 | $25,107 |
| Standard Deviation (Population) | $27,216 | $24,874 |
Similar Demographics by Householder Income Over 65 years
Demographics Similar to Immigrants from Korea by Householder Income Over 65 years
In terms of householder income over 65 years, the demographic groups most similar to Immigrants from Korea are Okinawan ($70,846, a difference of 0.21%), Eastern European ($70,470, a difference of 0.32%), Native Hawaiian ($71,021, a difference of 0.46%), Burmese ($71,139, a difference of 0.63%), and Indian (Asian) ($70,238, a difference of 0.65%).
| Demographics | Rating | Rank | Householder Income Over 65 years |
| Bhutanese | 100.0 /100 | #10 | Exceptional $72,288 |
| Thais | 100.0 /100 | #11 | Exceptional $72,099 |
| Cypriots | 100.0 /100 | #12 | Exceptional $71,714 |
| Immigrants | Hong Kong | 100.0 /100 | #13 | Exceptional $71,567 |
| Burmese | 100.0 /100 | #14 | Exceptional $71,139 |
| Native Hawaiians | 100.0 /100 | #15 | Exceptional $71,021 |
| Okinawans | 100.0 /100 | #16 | Exceptional $70,846 |
| Immigrants | Korea | 100.0 /100 | #17 | Exceptional $70,696 |
| Eastern Europeans | 100.0 /100 | #18 | Exceptional $70,470 |
| Indians (Asian) | 100.0 /100 | #19 | Exceptional $70,238 |
| Immigrants | South Central Asia | 100.0 /100 | #20 | Exceptional $70,103 |
| Immigrants | Eastern Asia | 100.0 /100 | #21 | Exceptional $69,872 |
| Immigrants | Israel | 100.0 /100 | #22 | Exceptional $69,857 |
| Immigrants | Japan | 100.0 /100 | #23 | Exceptional $69,774 |
| Immigrants | Sweden | 100.0 /100 | #24 | Exceptional $69,722 |
Demographics Similar to Costa Ricans by Householder Income Over 65 years
In terms of householder income over 65 years, the demographic groups most similar to Costa Ricans are Armenian ($61,656, a difference of 0.030%), Swiss ($61,621, a difference of 0.030%), Hungarian ($61,673, a difference of 0.060%), Polish ($61,598, a difference of 0.060%), and Scandinavian ($61,586, a difference of 0.080%).
| Demographics | Rating | Rank | Householder Income Over 65 years |
| Immigrants | Southern Europe | 72.7 /100 | #146 | Good $61,902 |
| Immigrants | Nepal | 71.4 /100 | #147 | Good $61,843 |
| Alsatians | 70.5 /100 | #148 | Good $61,797 |
| Scottish | 69.1 /100 | #149 | Good $61,735 |
| Slavs | 68.5 /100 | #150 | Good $61,709 |
| Hungarians | 67.7 /100 | #151 | Good $61,673 |
| Armenians | 67.3 /100 | #152 | Good $61,656 |
| Costa Ricans | 66.9 /100 | #153 | Good $61,638 |
| Swiss | 66.5 /100 | #154 | Good $61,621 |
| Poles | 65.9 /100 | #155 | Good $61,598 |
| Scandinavians | 65.6 /100 | #156 | Good $61,586 |
| Macedonians | 65.1 /100 | #157 | Good $61,564 |
| English | 63.3 /100 | #158 | Good $61,487 |
| Brazilians | 62.7 /100 | #159 | Good $61,465 |
| Portuguese | 62.1 /100 | #160 | Good $61,440 |