Immigrants from Nicaragua vs Costa Rican Householder Income Over 65 years
COMPARE
Immigrants from Nicaragua
Costa Rican
Householder Income Over 65 years
Householder Income Over 65 years Comparison
Immigrants from Nicaragua
Costa Ricans
$52,085
HOUSEHOLDER INCOME OVER 65 YEARS
0.0/ 100
METRIC RATING
313th/ 347
METRIC RANK
$61,638
HOUSEHOLDER INCOME OVER 65 YEARS
66.9/ 100
METRIC RATING
153rd/ 347
METRIC RANK
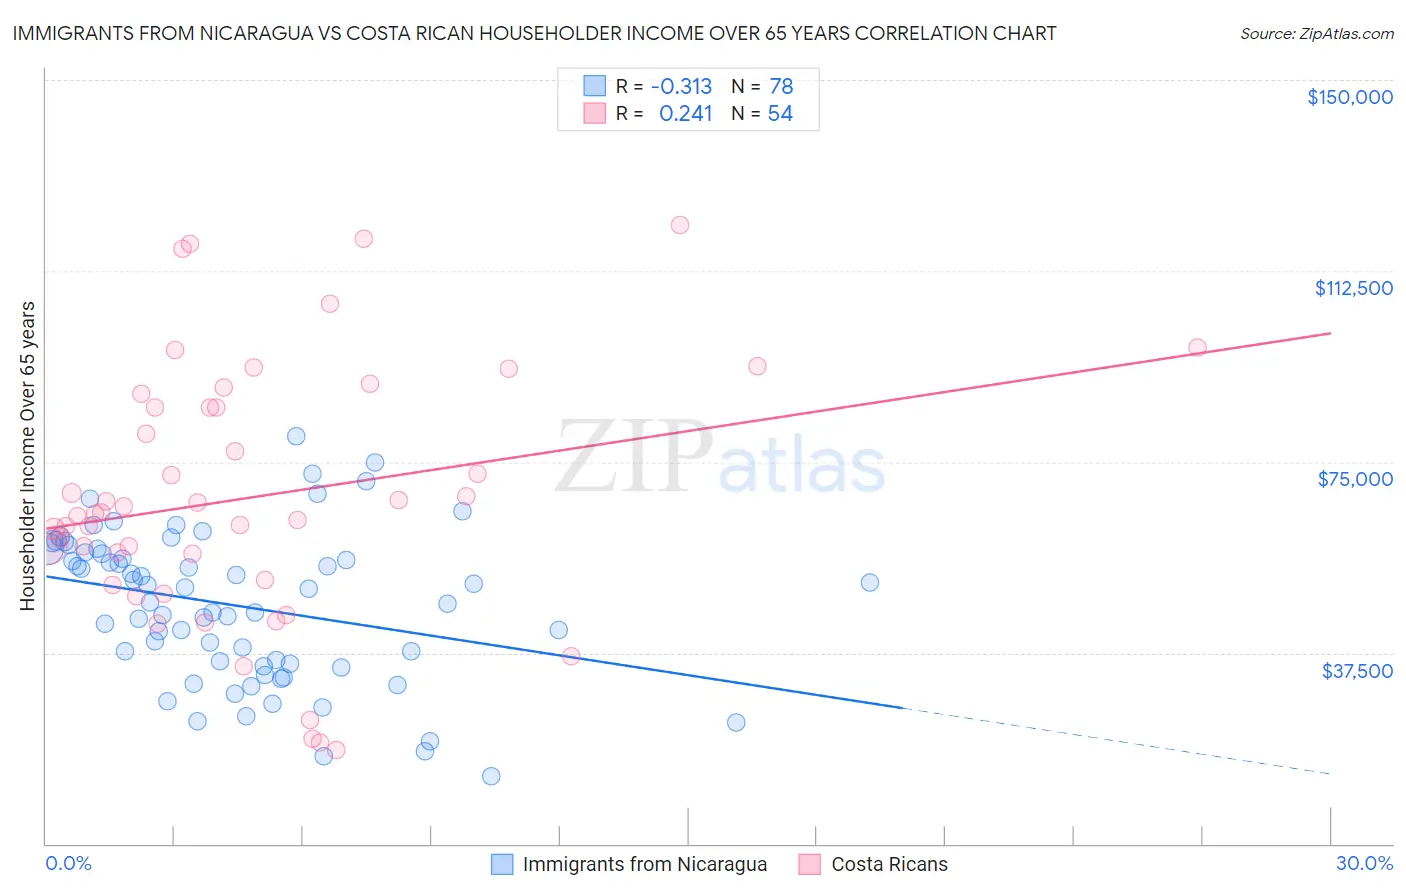
Immigrants from Nicaragua vs Costa Rican Householder Income Over 65 years Correlation Chart
The statistical analysis conducted on geographies consisting of 236,036,400 people shows a mild negative correlation between the proportion of Immigrants from Nicaragua and household income with householder over the age of 65 in the United States with a correlation coefficient (R) of -0.313 and weighted average of $52,085. Similarly, the statistical analysis conducted on geographies consisting of 253,120,412 people shows a weak positive correlation between the proportion of Costa Ricans and household income with householder over the age of 65 in the United States with a correlation coefficient (R) of 0.241 and weighted average of $61,638, a difference of 18.3%.
Householder Income Over 65 years Correlation Summary
| Measurement | Immigrants from Nicaragua | Costa Rican |
| Minimum | $13,371 | $18,343 |
| Maximum | $80,000 | $121,538 |
| Range | $66,629 | $103,195 |
| Mean | $46,721 | $68,075 |
| Median | $48,735 | $64,957 |
| Interquartile 25% (IQ1) | $35,431 | $51,771 |
| Interquartile 75% (IQ3) | $57,245 | $85,791 |
| Interquartile Range (IQR) | $21,814 | $34,020 |
| Standard Deviation (Sample) | $14,647 | $25,107 |
| Standard Deviation (Population) | $14,553 | $24,874 |
Similar Demographics by Householder Income Over 65 years
Demographics Similar to Immigrants from Nicaragua by Householder Income Over 65 years
In terms of householder income over 65 years, the demographic groups most similar to Immigrants from Nicaragua are Native/Alaskan ($52,081, a difference of 0.010%), U.S. Virgin Islander ($52,072, a difference of 0.020%), Immigrants from the Azores ($52,121, a difference of 0.070%), Creek ($51,949, a difference of 0.26%), and Immigrants from St. Vincent and the Grenadines ($51,922, a difference of 0.31%).
| Demographics | Rating | Rank | Householder Income Over 65 years |
| Pennsylvania Germans | 0.0 /100 | #306 | Tragic $52,888 |
| Hispanics or Latinos | 0.0 /100 | #307 | Tragic $52,832 |
| Immigrants | Mexico | 0.0 /100 | #308 | Tragic $52,801 |
| Hondurans | 0.0 /100 | #309 | Tragic $52,634 |
| Sioux | 0.0 /100 | #310 | Tragic $52,509 |
| Seminole | 0.0 /100 | #311 | Tragic $52,373 |
| Immigrants | Azores | 0.0 /100 | #312 | Tragic $52,121 |
| Immigrants | Nicaragua | 0.0 /100 | #313 | Tragic $52,085 |
| Natives/Alaskans | 0.0 /100 | #314 | Tragic $52,081 |
| U.S. Virgin Islanders | 0.0 /100 | #315 | Tragic $52,072 |
| Creek | 0.0 /100 | #316 | Tragic $51,949 |
| Immigrants | St. Vincent and the Grenadines | 0.0 /100 | #317 | Tragic $51,922 |
| Haitians | 0.0 /100 | #318 | Tragic $51,912 |
| Immigrants | Honduras | 0.0 /100 | #319 | Tragic $51,888 |
| Colville | 0.0 /100 | #320 | Tragic $51,739 |
Demographics Similar to Costa Ricans by Householder Income Over 65 years
In terms of householder income over 65 years, the demographic groups most similar to Costa Ricans are Armenian ($61,656, a difference of 0.030%), Swiss ($61,621, a difference of 0.030%), Hungarian ($61,673, a difference of 0.060%), Polish ($61,598, a difference of 0.060%), and Scandinavian ($61,586, a difference of 0.080%).
| Demographics | Rating | Rank | Householder Income Over 65 years |
| Immigrants | Southern Europe | 72.7 /100 | #146 | Good $61,902 |
| Immigrants | Nepal | 71.4 /100 | #147 | Good $61,843 |
| Alsatians | 70.5 /100 | #148 | Good $61,797 |
| Scottish | 69.1 /100 | #149 | Good $61,735 |
| Slavs | 68.5 /100 | #150 | Good $61,709 |
| Hungarians | 67.7 /100 | #151 | Good $61,673 |
| Armenians | 67.3 /100 | #152 | Good $61,656 |
| Costa Ricans | 66.9 /100 | #153 | Good $61,638 |
| Swiss | 66.5 /100 | #154 | Good $61,621 |
| Poles | 65.9 /100 | #155 | Good $61,598 |
| Scandinavians | 65.6 /100 | #156 | Good $61,586 |
| Macedonians | 65.1 /100 | #157 | Good $61,564 |
| English | 63.3 /100 | #158 | Good $61,487 |
| Brazilians | 62.7 /100 | #159 | Good $61,465 |
| Portuguese | 62.1 /100 | #160 | Good $61,440 |