Armenian vs Costa Rican Householder Income Over 65 years
COMPARE
Armenian
Costa Rican
Householder Income Over 65 years
Householder Income Over 65 years Comparison
Armenians
Costa Ricans
$61,656
HOUSEHOLDER INCOME OVER 65 YEARS
67.3/ 100
METRIC RATING
152nd/ 347
METRIC RANK
$61,638
HOUSEHOLDER INCOME OVER 65 YEARS
66.9/ 100
METRIC RATING
153rd/ 347
METRIC RANK
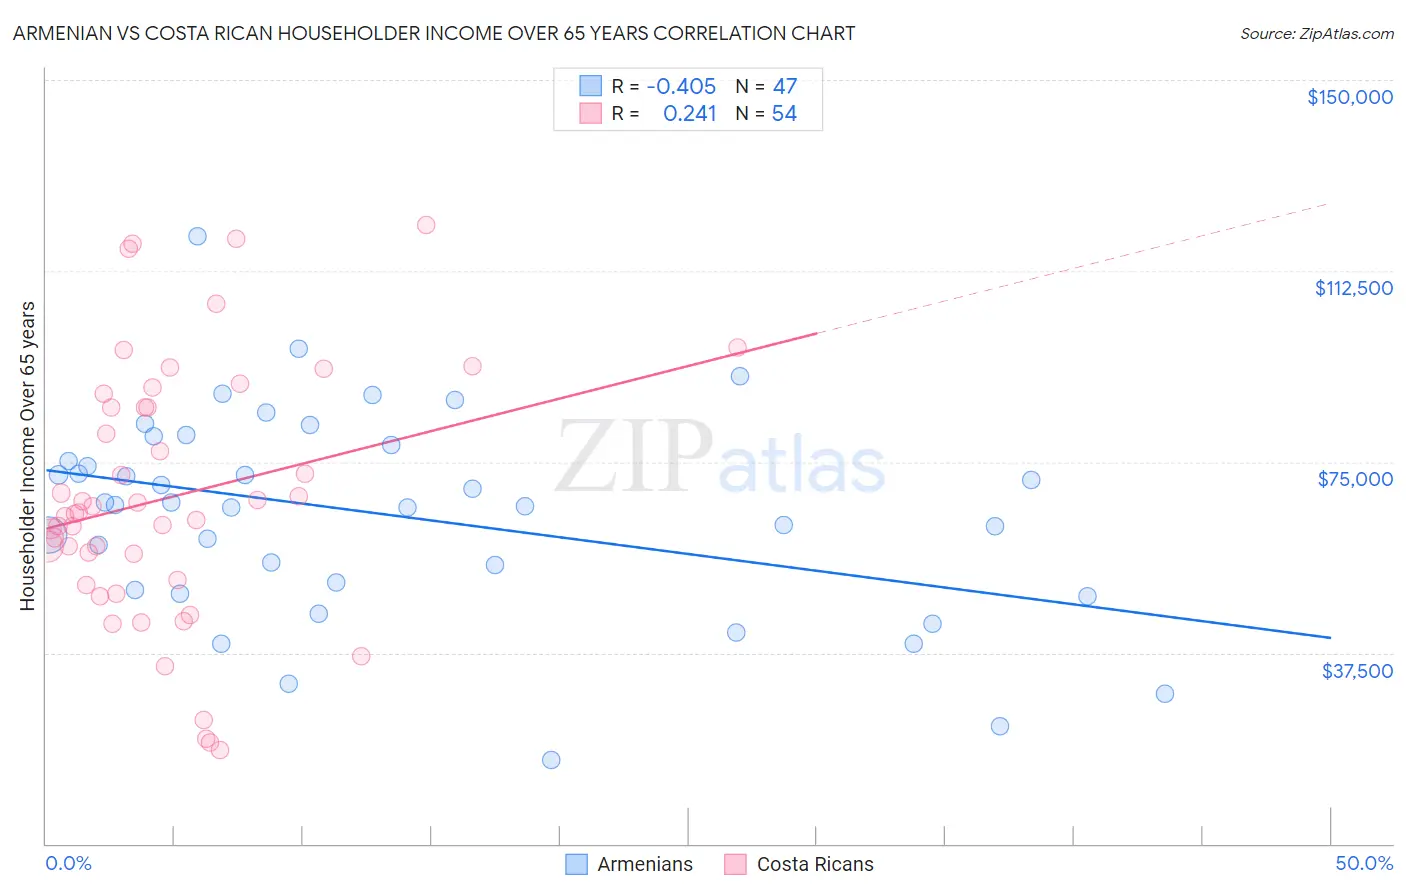
Armenian vs Costa Rican Householder Income Over 65 years Correlation Chart
The statistical analysis conducted on geographies consisting of 310,212,557 people shows a moderate negative correlation between the proportion of Armenians and household income with householder over the age of 65 in the United States with a correlation coefficient (R) of -0.405 and weighted average of $61,656. Similarly, the statistical analysis conducted on geographies consisting of 253,120,412 people shows a weak positive correlation between the proportion of Costa Ricans and household income with householder over the age of 65 in the United States with a correlation coefficient (R) of 0.241 and weighted average of $61,638, a difference of 0.030%.
Householder Income Over 65 years Correlation Summary
| Measurement | Armenian | Costa Rican |
| Minimum | $16,529 | $18,343 |
| Maximum | $119,275 | $121,538 |
| Range | $102,746 | $103,195 |
| Mean | $64,521 | $68,075 |
| Median | $66,568 | $64,957 |
| Interquartile 25% (IQ1) | $49,918 | $51,771 |
| Interquartile 75% (IQ3) | $78,241 | $85,791 |
| Interquartile Range (IQR) | $28,323 | $34,020 |
| Standard Deviation (Sample) | $20,266 | $25,107 |
| Standard Deviation (Population) | $20,049 | $24,874 |
Demographics Similar to Armenians and Costa Ricans by Householder Income Over 65 years
In terms of householder income over 65 years, the demographic groups most similar to Armenians are Hungarian ($61,673, a difference of 0.030%), Swiss ($61,621, a difference of 0.060%), Slavic ($61,709, a difference of 0.090%), Polish ($61,598, a difference of 0.090%), and Scandinavian ($61,586, a difference of 0.11%). Similarly, the demographic groups most similar to Costa Ricans are Swiss ($61,621, a difference of 0.030%), Hungarian ($61,673, a difference of 0.060%), Polish ($61,598, a difference of 0.060%), Scandinavian ($61,586, a difference of 0.080%), and Slavic ($61,709, a difference of 0.12%).
| Demographics | Rating | Rank | Householder Income Over 65 years |
| South American Indians | 78.7 /100 | #142 | Good $62,215 |
| Immigrants | Belarus | 77.8 /100 | #143 | Good $62,162 |
| Immigrants | Peru | 74.4 /100 | #144 | Good $61,988 |
| Immigrants | Uganda | 74.2 /100 | #145 | Good $61,976 |
| Immigrants | Southern Europe | 72.7 /100 | #146 | Good $61,902 |
| Immigrants | Nepal | 71.4 /100 | #147 | Good $61,843 |
| Alsatians | 70.5 /100 | #148 | Good $61,797 |
| Scottish | 69.1 /100 | #149 | Good $61,735 |
| Slavs | 68.5 /100 | #150 | Good $61,709 |
| Hungarians | 67.7 /100 | #151 | Good $61,673 |
| Armenians | 67.3 /100 | #152 | Good $61,656 |
| Costa Ricans | 66.9 /100 | #153 | Good $61,638 |
| Swiss | 66.5 /100 | #154 | Good $61,621 |
| Poles | 65.9 /100 | #155 | Good $61,598 |
| Scandinavians | 65.6 /100 | #156 | Good $61,586 |
| Macedonians | 65.1 /100 | #157 | Good $61,564 |
| English | 63.3 /100 | #158 | Good $61,487 |
| Brazilians | 62.7 /100 | #159 | Good $61,465 |
| Portuguese | 62.1 /100 | #160 | Good $61,440 |
| Icelanders | 57.9 /100 | #161 | Average $61,270 |
| Czechs | 57.2 /100 | #162 | Average $61,244 |