Immigrants from Trinidad and Tobago vs Costa Rican Householder Income Over 65 years

COMPARE

Immigrants from Trinidad and Tobago
Race
Ancestry
AfghanAfricanAlaska NativeAlaskan AthabascanAlbanianAleutAlsatianAmericanApacheArabArapahoArgentineanArmenianAssyrian/Chaldean/SyriacAustralianAustrianBahamianBangladeshiBarbadianBasqueBelgianBelizeanBermudanBhutaneseBlackfeetBolivianBrazilianBritishBritish West IndianBulgarianBurmeseCajunCambodianCanadianCape VerdeanCarpatho RusynCelticCentral AmericanCentral American IndianCherokeeCheyenneChickasawChileanChineseChippewaChoctawColombianColvilleComancheCreeCreekCroatianCrowCubanCypriotCzechCzechoslovakianDanishDelawareDominicanDutchDutch West IndianEastern EuropeanEcuadorianEgyptianEnglishEstonianEthiopianEuropeanFijianFilipinoFinnishFrenchFrench American IndianFrench CanadianGermanGerman RussianGhanaianGreekGuamanian/ChamorroGuatemalanGuyaneseHaitianHmongHonduranHopiHoumaHungarianIcelanderIndian (Asian)IndonesianInupiatIranianIraqiIrishIroquoisIsraeliItalianJamaicanJapaneseJordanianKenyanKiowaKoreanLaotianLatvianLebaneseLiberianLithuanianLumbeeLuxembourgerMacedonianMalaysianMalteseMarshalleseMenomineeMexicanMexican American IndianMongolianMoroccanNative HawaiianNavajoNepaleseNew ZealanderNicaraguanNigerianNorthern EuropeanNorwegianOkinawanOsageOttawaPaiutePakistaniPalestinianPanamanianParaguayanPennsylvania GermanPeruvianPimaPolishPortuguesePotawatomiPuebloPuerto RicanPuget Sound SalishRomanianRussianSalvadoranSamoanScandinavianScotch-IrishScottishSeminoleSenegaleseSerbianShoshoneSierra LeoneanSiouxSlavicSlovakSloveneSomaliSouth AfricanSouth AmericanSouth American IndianSoviet UnionSpaniardSpanishSpanish AmericanSpanish American IndianSri LankanSubsaharan AfricanSudaneseSwedishSwissSyrianTaiwaneseThaiTlingit-HaidaTohono O'OdhamTonganTrinidadian and TobagonianTsimshianTurkishU.S. Virgin IslanderUgandanUkrainianUruguayanUteVenezuelanVietnameseWelshWest IndianYakamaYaquiYugoslavianYumanYup'ikZimbabwean
Immigration
NonimmigrantsImmigrantsAfghanistanAfricaAlbaniaArgentinaArmeniaAsiaAustraliaAustriaBahamasBangladeshBarbadosBelarusBelgiumBelizeBoliviaBosnia and HerzegovinaBrazilBulgariaBurma/MyanmarCabo VerdeCambodiaCameroonCanadaCaribbeanCentral AmericaChileChinaColombiaCongoCosta RicaCroatiaCubaCzechoslovakiaDenmarkDominicaDominican RepublicEastern AfricaEastern AsiaEastern EuropeEcuadorEgyptEl SalvadorEnglandEritreaEthiopiaEuropeFijiFranceGermanyGhanaGreeceGrenadaGuatemalaGuyanaHaitiHondurasHong KongHungaryIndiaIndonesiaIranIraqIrelandIsraelItalyJamaicaJapanJordanKazakhstanKenyaKoreaKuwaitLaosLatin AmericaLatviaLebanonLiberiaLithuaniaMalaysiaMexicoMicronesiaMiddle AfricaMoldovaMoroccoNepalNetherlandsNicaraguaNigeriaNorth AmericaNorth MacedoniaNorthern AfricaNorthern EuropeNorwayOceaniaPakistanPanamaPeruPhilippinesPolandPortugalRomaniaRussiaSaudi ArabiaScotlandSenegalSerbiaSierra LeoneSingaporeSomaliaSouth AfricaSouth AmericaSouth Central AsiaSouth Eastern AsiaSouthern EuropeSpainSri LankaSt. Vincent and the GrenadinesSudanSwedenSwitzerlandSyriaTaiwanThailandTrinidad and TobagoTurkeyUgandaUkraineUruguayUzbekistanVenezuelaVietnamWest IndiesWestern AfricaWestern AsiaWestern EuropeYemenZaireZimbabweAzores
Costa Rican
Race
Ancestry
AfghanAfricanAlaska NativeAlaskan AthabascanAlbanianAleutAlsatianAmericanApacheArabArapahoArgentineanArmenianAssyrian/Chaldean/SyriacAustralianAustrianBahamianBangladeshiBarbadianBasqueBelgianBelizeanBermudanBhutaneseBlackfeetBolivianBrazilianBritishBritish West IndianBulgarianBurmeseCajunCambodianCanadianCape VerdeanCarpatho RusynCelticCentral AmericanCentral American IndianCherokeeCheyenneChickasawChileanChineseChippewaChoctawColombianColvilleComancheCosta RicanCreeCreekCroatianCrowCubanCypriotCzechCzechoslovakianDanishDelawareDominicanDutchDutch West IndianEastern EuropeanEcuadorianEgyptianEnglishEstonianEthiopianEuropeanFijianFilipinoFinnishFrenchFrench American IndianFrench CanadianGermanGerman RussianGhanaianGreekGuamanian/ChamorroGuatemalanGuyaneseHaitianHmongHonduranHopiHoumaHungarianIcelanderIndian (Asian)IndonesianInupiatIranianIraqiIrishIroquoisIsraeliItalianJamaicanJapaneseJordanianKenyanKiowaKoreanLaotianLatvianLebaneseLiberianLithuanianLumbeeLuxembourgerMacedonianMalaysianMalteseMarshalleseMenomineeMexicanMexican American IndianMongolianMoroccanNative HawaiianNavajoNepaleseNew ZealanderNicaraguanNigerianNorthern EuropeanNorwegianOkinawanOsageOttawaPaiutePakistaniPalestinianPanamanianParaguayanPennsylvania GermanPeruvianPimaPolishPortuguesePotawatomiPuebloPuerto RicanPuget Sound SalishRomanianRussianSalvadoranSamoanScandinavianScotch-IrishScottishSeminoleSenegaleseSerbianShoshoneSierra LeoneanSiouxSlavicSlovakSloveneSomaliSouth AfricanSouth AmericanSouth American IndianSoviet UnionSpaniardSpanishSpanish AmericanSpanish American IndianSri LankanSubsaharan AfricanSudaneseSwedishSwissSyrianTaiwaneseThaiTlingit-HaidaTohono O'OdhamTonganTrinidadian and TobagonianTsimshianTurkishU.S. Virgin IslanderUgandanUkrainianUruguayanUteVenezuelanVietnameseWelshWest IndianYakamaYaquiYugoslavianYumanYup'ikZimbabwean
Immigration
NonimmigrantsImmigrantsAfghanistanAfricaAlbaniaArgentinaArmeniaAsiaAustraliaAustriaBahamasBangladeshBarbadosBelarusBelgiumBelizeBoliviaBosnia and HerzegovinaBrazilBulgariaBurma/MyanmarCabo VerdeCambodiaCameroonCanadaCaribbeanCentral AmericaChileChinaColombiaCongoCosta RicaCroatiaCubaCzechoslovakiaDenmarkDominicaDominican RepublicEastern AfricaEastern AsiaEastern EuropeEcuadorEgyptEl SalvadorEnglandEritreaEthiopiaEuropeFijiFranceGermanyGhanaGreeceGrenadaGuatemalaGuyanaHaitiHondurasHong KongHungaryIndiaIndonesiaIranIraqIrelandIsraelItalyJamaicaJapanJordanKazakhstanKenyaKoreaKuwaitLaosLatin AmericaLatviaLebanonLiberiaLithuaniaMalaysiaMexicoMicronesiaMiddle AfricaMoldovaMoroccoNepalNetherlandsNicaraguaNigeriaNorth AmericaNorth MacedoniaNorthern AfricaNorthern EuropeNorwayOceaniaPakistanPanamaPeruPhilippinesPolandPortugalRomaniaRussiaSaudi ArabiaScotlandSenegalSerbiaSierra LeoneSingaporeSomaliaSouth AfricaSouth AmericaSouth Central AsiaSouth Eastern AsiaSouthern EuropeSpainSri LankaSt. Vincent and the GrenadinesSudanSwedenSwitzerlandSyriaTaiwanThailandTurkeyUgandaUkraineUruguayUzbekistanVenezuelaVietnamWest IndiesWestern AfricaWestern AsiaWestern EuropeYemenZaireZimbabweAzores
Householder Income Over 65 years
Income
Poverty
Unemployment
Labor Participation
Family Structure
Vehicle Availability
Education Level
Disability

Householder Income Over 65 years Comparison

Immigrants from Trinidad and Tobago

Costa Ricans

Tragic
Good
$55,598
HOUSEHOLDER INCOME OVER 65 YEARS
0.4/ 100
METRIC RATING
253rd/ 347
METRIC RANK
$61,638
HOUSEHOLDER INCOME OVER 65 YEARS
66.9/ 100
METRIC RATING
153rd/ 347
METRIC RANK

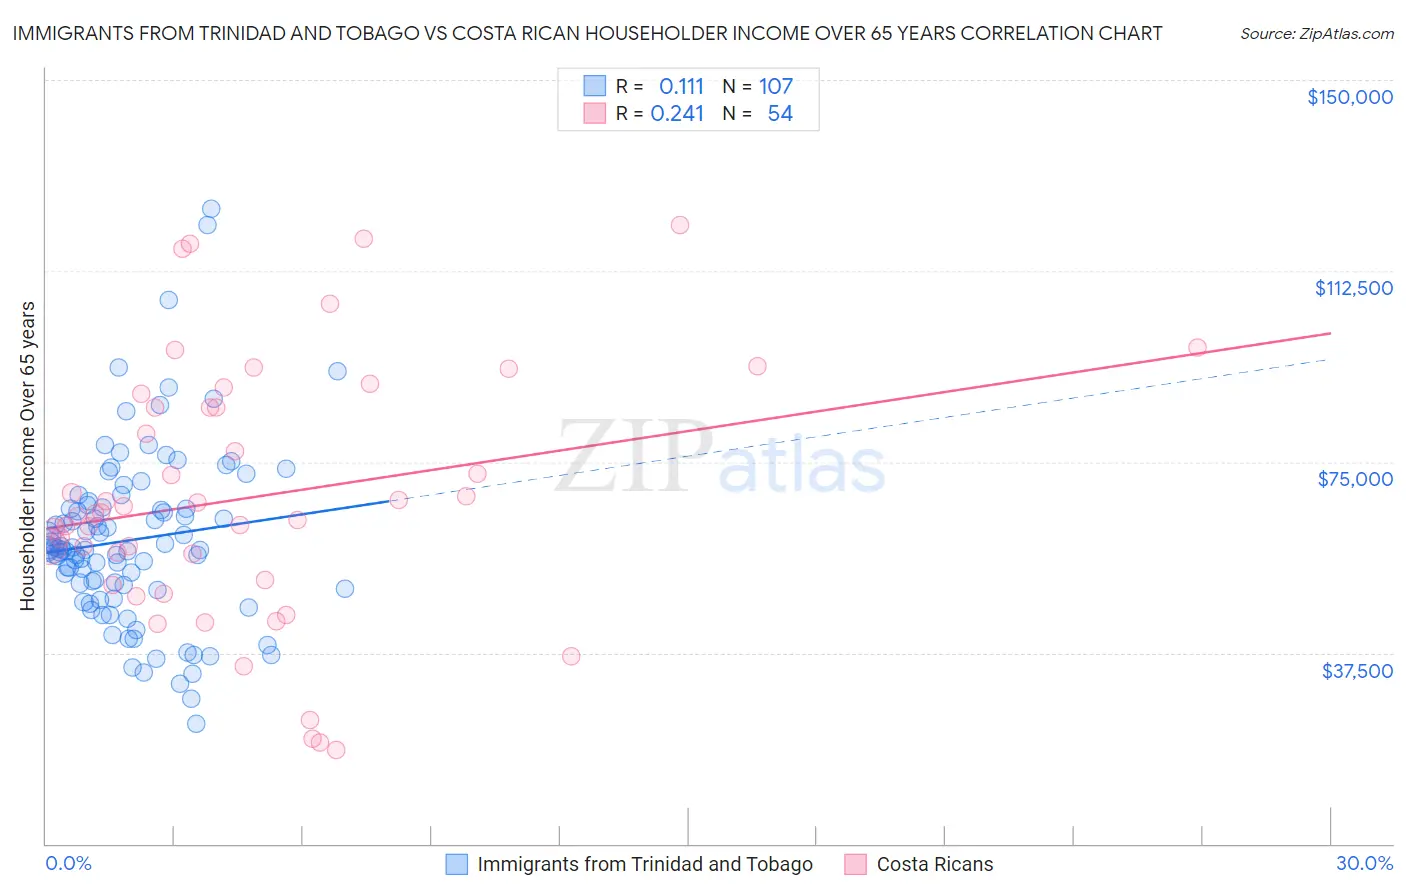
Immigrants from Trinidad and Tobago vs Costa Rican Householder Income Over 65 years Correlation Chart

The statistical analysis conducted on geographies consisting of 223,183,074 people shows a poor positive correlation between the proportion of Immigrants from Trinidad and Tobago and household income with householder over the age of 65 in the United States with a correlation coefficient (R) of 0.111 and weighted average of $55,598. Similarly, the statistical analysis conducted on geographies consisting of 253,120,412 people shows a weak positive correlation between the proportion of Costa Ricans and household income with householder over the age of 65 in the United States with a correlation coefficient (R) of 0.241 and weighted average of $61,638, a difference of 10.9%.
Immigrants from Trinidad and Tobago vs Costa Rican Householder Income Over 65 years

Householder Income Over 65 years Correlation Summary

MeasurementImmigrants from Trinidad and TobagoCosta Rican
Minimum$23,659$18,343
Maximum$124,816$121,538
Range$101,157$103,195
Mean$59,659$68,075
Median$57,844$64,957
Interquartile 25% (IQ1)$50,192$51,771
Interquartile 75% (IQ3)$65,956$85,791
Interquartile Range (IQR)$15,764$34,020
Standard Deviation (Sample)$17,128$25,107
Standard Deviation (Population)$17,048$24,874

Similar Demographics by Householder Income Over 65 years

Demographics Similar to Immigrants from Trinidad and Tobago by Householder Income Over 65 years

In terms of householder income over 65 years, the demographic groups most similar to Immigrants from Trinidad and Tobago are American ($55,527, a difference of 0.13%), Osage ($55,677, a difference of 0.14%), Immigrants from Bangladesh ($55,394, a difference of 0.37%), German Russian ($55,356, a difference of 0.44%), and Trinidadian and Tobagonian ($55,327, a difference of 0.49%).
DemographicsRating | RankHouseholder Income Over 65 years
Central Americans
0.8
/100
|
#246
Tragic
$56,321
Yakama
0.7
/100
|
#247
Tragic
$56,234
Vietnamese
0.6
/100
|
#248
Tragic
$56,143
Mexican American Indians
0.6
/100
|
#249
Tragic
$56,089
Immigrants | Bosnia and Herzegovina
0.5
/100
|
#250
Tragic
$55,986
Immigrants | Portugal
0.5
/100
|
#251
Tragic
$55,924
Osage
0.4
/100
|
#252
Tragic
$55,677
Immigrants | Trinidad and Tobago
0.4
/100
|
#253
Tragic
$55,598
Americans
0.3
/100
|
#254
Tragic
$55,527
Immigrants | Bangladesh
0.3
/100
|
#255
Tragic
$55,394
German Russians
0.3
/100
|
#256
Tragic
$55,356
Trinidadians and Tobagonians
0.3
/100
|
#257
Tragic
$55,327
Ecuadorians
0.2
/100
|
#258
Tragic
$54,958
West Indians
0.2
/100
|
#259
Tragic
$54,936
Immigrants | West Indies
0.2
/100
|
#260
Tragic
$54,927

Demographics Similar to Costa Ricans by Householder Income Over 65 years

In terms of householder income over 65 years, the demographic groups most similar to Costa Ricans are Armenian ($61,656, a difference of 0.030%), Swiss ($61,621, a difference of 0.030%), Hungarian ($61,673, a difference of 0.060%), Polish ($61,598, a difference of 0.060%), and Scandinavian ($61,586, a difference of 0.080%).
DemographicsRating | RankHouseholder Income Over 65 years
Immigrants | Southern Europe
72.7
/100
|
#146
Good
$61,902
Immigrants | Nepal
71.4
/100
|
#147
Good
$61,843
Alsatians
70.5
/100
|
#148
Good
$61,797
Scottish
69.1
/100
|
#149
Good
$61,735
Slavs
68.5
/100
|
#150
Good
$61,709
Hungarians
67.7
/100
|
#151
Good
$61,673
Armenians
67.3
/100
|
#152
Good
$61,656
Costa Ricans
66.9
/100
|
#153
Good
$61,638
Swiss
66.5
/100
|
#154
Good
$61,621
Poles
65.9
/100
|
#155
Good
$61,598
Scandinavians
65.6
/100
|
#156
Good
$61,586
Macedonians
65.1
/100
|
#157
Good
$61,564
English
63.3
/100
|
#158
Good
$61,487
Brazilians
62.7
/100
|
#159
Good
$61,465
Portuguese
62.1
/100
|
#160
Good
$61,440