Laotian vs Immigrants from Panama Per Capita Income
COMPARE
Laotian
Immigrants from Panama
Per Capita Income
Per Capita Income Comparison
Laotians
Immigrants from Panama
$47,041
PER CAPITA INCOME
97.8/ 100
METRIC RATING
99th/ 347
METRIC RANK
$41,853
PER CAPITA INCOME
11.6/ 100
METRIC RATING
211th/ 347
METRIC RANK
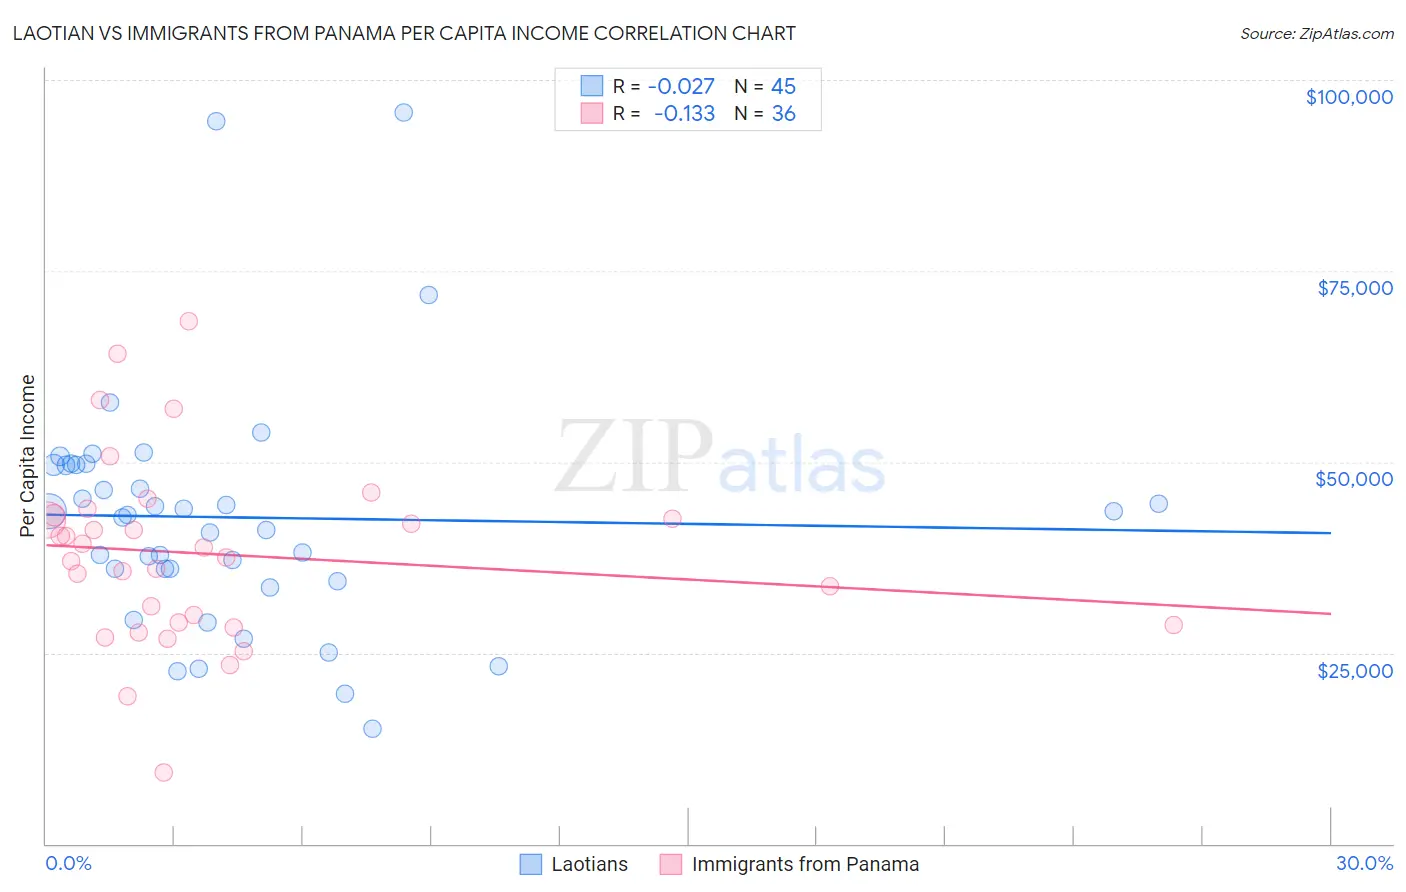
Laotian vs Immigrants from Panama Per Capita Income Correlation Chart
The statistical analysis conducted on geographies consisting of 224,867,233 people shows no correlation between the proportion of Laotians and per capita income in the United States with a correlation coefficient (R) of -0.027 and weighted average of $47,041. Similarly, the statistical analysis conducted on geographies consisting of 221,187,071 people shows a poor negative correlation between the proportion of Immigrants from Panama and per capita income in the United States with a correlation coefficient (R) of -0.133 and weighted average of $41,853, a difference of 12.4%.
Per Capita Income Correlation Summary
| Measurement | Laotian | Immigrants from Panama |
| Minimum | $14,980 | $9,397 |
| Maximum | $95,805 | $68,465 |
| Range | $80,825 | $59,068 |
| Mean | $42,727 | $37,915 |
| Median | $43,043 | $38,159 |
| Interquartile 25% (IQ1) | $35,205 | $28,812 |
| Interquartile 75% (IQ3) | $49,592 | $42,786 |
| Interquartile Range (IQR) | $14,387 | $13,974 |
| Standard Deviation (Sample) | $15,836 | $12,078 |
| Standard Deviation (Population) | $15,659 | $11,909 |
Similar Demographics by Per Capita Income
Demographics Similar to Laotians by Per Capita Income
In terms of per capita income, the demographic groups most similar to Laotians are Immigrants from Pakistan ($47,084, a difference of 0.090%), Immigrants from Lebanon ($46,938, a difference of 0.22%), Immigrants from Uzbekistan ($46,929, a difference of 0.24%), Immigrants from Western Asia ($46,876, a difference of 0.35%), and Syrian ($46,837, a difference of 0.43%).
| Demographics | Rating | Rank | Per Capita Income |
| Immigrants | Moldova | 98.7 /100 | #92 | Exceptional $47,489 |
| Immigrants | Zimbabwe | 98.5 /100 | #93 | Exceptional $47,394 |
| Albanians | 98.5 /100 | #94 | Exceptional $47,379 |
| Immigrants | Egypt | 98.5 /100 | #95 | Exceptional $47,361 |
| Alsatians | 98.3 /100 | #96 | Exceptional $47,284 |
| Carpatho Rusyns | 98.2 /100 | #97 | Exceptional $47,248 |
| Immigrants | Pakistan | 97.9 /100 | #98 | Exceptional $47,084 |
| Laotians | 97.8 /100 | #99 | Exceptional $47,041 |
| Immigrants | Lebanon | 97.5 /100 | #100 | Exceptional $46,938 |
| Immigrants | Uzbekistan | 97.5 /100 | #101 | Exceptional $46,929 |
| Immigrants | Western Asia | 97.4 /100 | #102 | Exceptional $46,876 |
| Syrians | 97.2 /100 | #103 | Exceptional $46,837 |
| Brazilians | 96.8 /100 | #104 | Exceptional $46,700 |
| British | 96.3 /100 | #105 | Exceptional $46,571 |
| Ethiopians | 96.3 /100 | #106 | Exceptional $46,569 |
Demographics Similar to Immigrants from Panama by Per Capita Income
In terms of per capita income, the demographic groups most similar to Immigrants from Panama are Immigrants from Senegal ($41,830, a difference of 0.050%), Ecuadorian ($41,958, a difference of 0.25%), Immigrants from Venezuela ($41,727, a difference of 0.30%), Immigrants from Sudan ($41,986, a difference of 0.32%), and Immigrants from Bangladesh ($41,709, a difference of 0.34%).
| Demographics | Rating | Rank | Per Capita Income |
| Aleuts | 16.4 /100 | #204 | Poor $42,210 |
| Whites/Caucasians | 15.9 /100 | #205 | Poor $42,180 |
| Ghanaians | 15.7 /100 | #206 | Poor $42,164 |
| Venezuelans | 14.4 /100 | #207 | Poor $42,074 |
| Panamanians | 13.9 /100 | #208 | Poor $42,035 |
| Immigrants | Sudan | 13.2 /100 | #209 | Poor $41,986 |
| Ecuadorians | 12.9 /100 | #210 | Poor $41,958 |
| Immigrants | Panama | 11.6 /100 | #211 | Poor $41,853 |
| Immigrants | Senegal | 11.3 /100 | #212 | Poor $41,830 |
| Immigrants | Venezuela | 10.2 /100 | #213 | Poor $41,727 |
| Immigrants | Bangladesh | 10.1 /100 | #214 | Poor $41,709 |
| Sudanese | 9.9 /100 | #215 | Tragic $41,695 |
| Tongans | 9.9 /100 | #216 | Tragic $41,693 |
| Guamanians/Chamorros | 9.7 /100 | #217 | Tragic $41,678 |
| Trinidadians and Tobagonians | 9.5 /100 | #218 | Tragic $41,655 |