Laotian vs Palestinian Per Capita Income
COMPARE
Laotian
Palestinian
Per Capita Income
Per Capita Income Comparison
Laotians
Palestinians
$47,041
PER CAPITA INCOME
97.8/ 100
METRIC RATING
99th/ 347
METRIC RANK
$45,790
PER CAPITA INCOME
91.6/ 100
METRIC RATING
126th/ 347
METRIC RANK
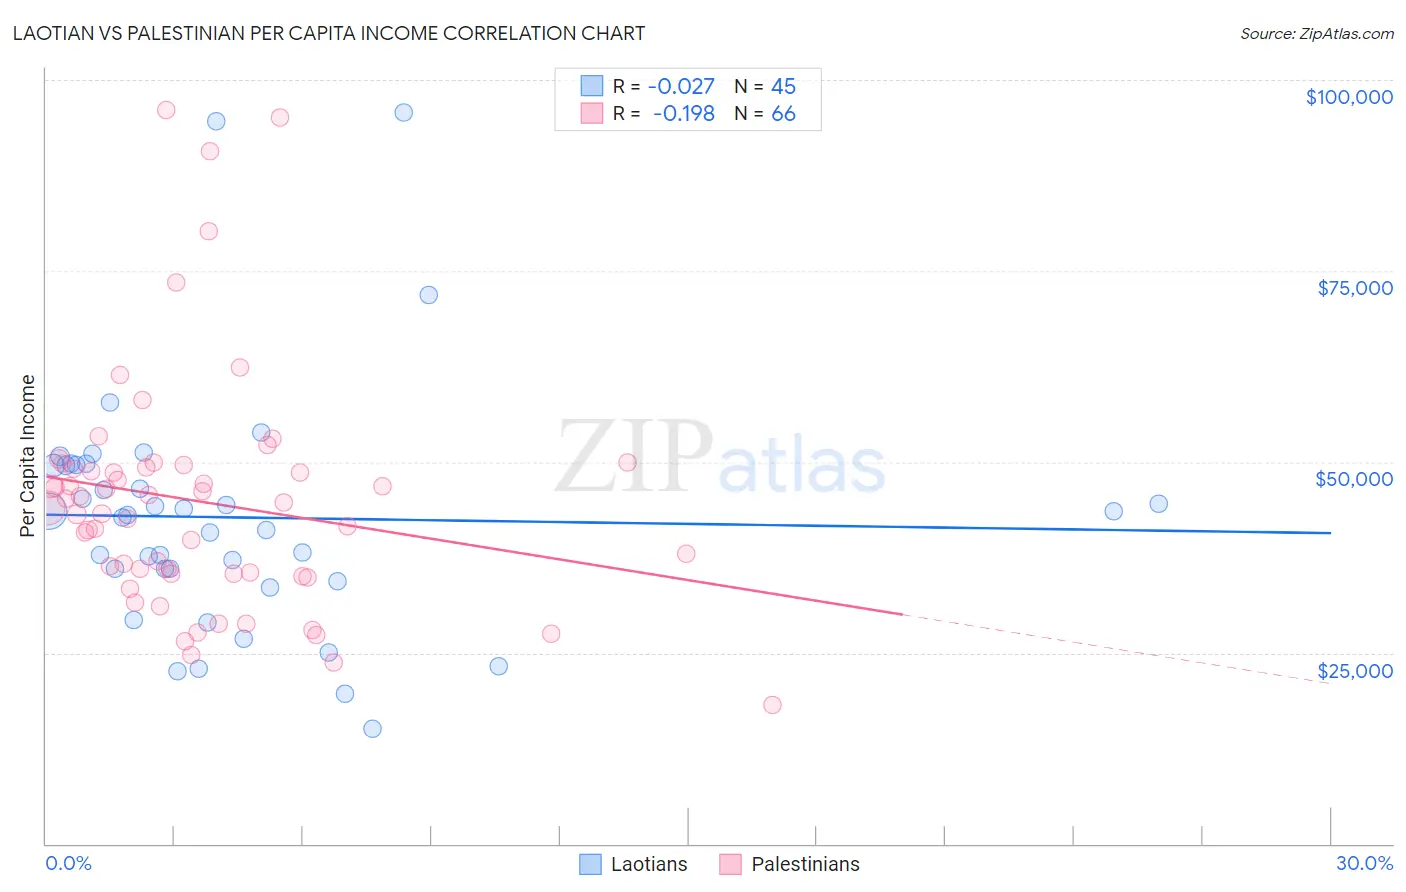
Laotian vs Palestinian Per Capita Income Correlation Chart
The statistical analysis conducted on geographies consisting of 224,867,233 people shows no correlation between the proportion of Laotians and per capita income in the United States with a correlation coefficient (R) of -0.027 and weighted average of $47,041. Similarly, the statistical analysis conducted on geographies consisting of 216,465,639 people shows a poor negative correlation between the proportion of Palestinians and per capita income in the United States with a correlation coefficient (R) of -0.198 and weighted average of $45,790, a difference of 2.7%.
Per Capita Income Correlation Summary
| Measurement | Laotian | Palestinian |
| Minimum | $14,980 | $18,117 |
| Maximum | $95,805 | $96,141 |
| Range | $80,825 | $78,024 |
| Mean | $42,727 | $44,786 |
| Median | $43,043 | $44,344 |
| Interquartile 25% (IQ1) | $35,205 | $35,413 |
| Interquartile 75% (IQ3) | $49,592 | $49,208 |
| Interquartile Range (IQR) | $14,387 | $13,795 |
| Standard Deviation (Sample) | $15,836 | $15,475 |
| Standard Deviation (Population) | $15,659 | $15,357 |
Similar Demographics by Per Capita Income
Demographics Similar to Laotians by Per Capita Income
In terms of per capita income, the demographic groups most similar to Laotians are Immigrants from Pakistan ($47,084, a difference of 0.090%), Immigrants from Lebanon ($46,938, a difference of 0.22%), Immigrants from Uzbekistan ($46,929, a difference of 0.24%), Immigrants from Western Asia ($46,876, a difference of 0.35%), and Syrian ($46,837, a difference of 0.43%).
| Demographics | Rating | Rank | Per Capita Income |
| Immigrants | Moldova | 98.7 /100 | #92 | Exceptional $47,489 |
| Immigrants | Zimbabwe | 98.5 /100 | #93 | Exceptional $47,394 |
| Albanians | 98.5 /100 | #94 | Exceptional $47,379 |
| Immigrants | Egypt | 98.5 /100 | #95 | Exceptional $47,361 |
| Alsatians | 98.3 /100 | #96 | Exceptional $47,284 |
| Carpatho Rusyns | 98.2 /100 | #97 | Exceptional $47,248 |
| Immigrants | Pakistan | 97.9 /100 | #98 | Exceptional $47,084 |
| Laotians | 97.8 /100 | #99 | Exceptional $47,041 |
| Immigrants | Lebanon | 97.5 /100 | #100 | Exceptional $46,938 |
| Immigrants | Uzbekistan | 97.5 /100 | #101 | Exceptional $46,929 |
| Immigrants | Western Asia | 97.4 /100 | #102 | Exceptional $46,876 |
| Syrians | 97.2 /100 | #103 | Exceptional $46,837 |
| Brazilians | 96.8 /100 | #104 | Exceptional $46,700 |
| British | 96.3 /100 | #105 | Exceptional $46,571 |
| Ethiopians | 96.3 /100 | #106 | Exceptional $46,569 |
Demographics Similar to Palestinians by Per Capita Income
In terms of per capita income, the demographic groups most similar to Palestinians are Zimbabwean ($45,804, a difference of 0.030%), Immigrants from Germany ($45,751, a difference of 0.090%), Swedish ($45,750, a difference of 0.090%), European ($45,836, a difference of 0.10%), and Lebanese ($45,840, a difference of 0.11%).
| Demographics | Rating | Rank | Per Capita Income |
| Immigrants | Poland | 93.1 /100 | #119 | Exceptional $45,979 |
| Immigrants | Ethiopia | 92.7 /100 | #120 | Exceptional $45,923 |
| Canadians | 92.2 /100 | #121 | Exceptional $45,858 |
| Moroccans | 92.1 /100 | #122 | Exceptional $45,854 |
| Lebanese | 92.0 /100 | #123 | Exceptional $45,840 |
| Europeans | 92.0 /100 | #124 | Exceptional $45,836 |
| Zimbabweans | 91.7 /100 | #125 | Exceptional $45,804 |
| Palestinians | 91.6 /100 | #126 | Exceptional $45,790 |
| Immigrants | Germany | 91.3 /100 | #127 | Exceptional $45,751 |
| Swedes | 91.3 /100 | #128 | Exceptional $45,750 |
| Luxembourgers | 90.4 /100 | #129 | Exceptional $45,663 |
| Arabs | 90.4 /100 | #130 | Exceptional $45,662 |
| Immigrants | North Macedonia | 90.0 /100 | #131 | Exceptional $45,622 |
| Jordanians | 89.9 /100 | #132 | Excellent $45,605 |
| Pakistanis | 89.7 /100 | #133 | Excellent $45,587 |