Korean vs Vietnamese Median Female Earnings
COMPARE
Korean
Vietnamese
Median Female Earnings
Median Female Earnings Comparison
Koreans
Vietnamese
$41,276
MEDIAN FEMALE EARNINGS
96.4/ 100
METRIC RATING
115th/ 347
METRIC RANK
$40,377
MEDIAN FEMALE EARNINGS
80.4/ 100
METRIC RATING
147th/ 347
METRIC RANK
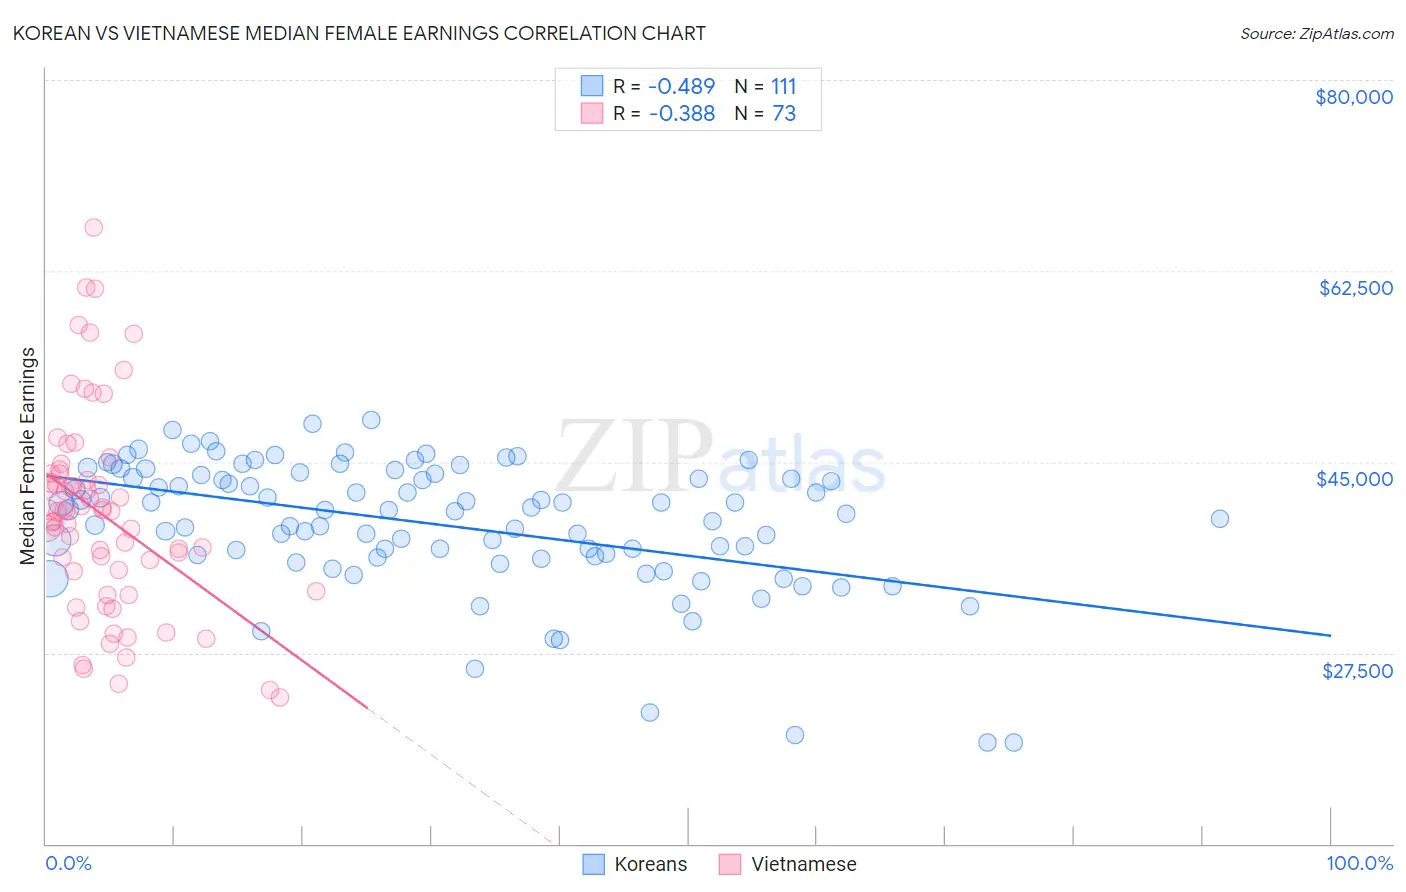
Korean vs Vietnamese Median Female Earnings Correlation Chart
The statistical analysis conducted on geographies consisting of 510,529,365 people shows a moderate negative correlation between the proportion of Koreans and median female earnings in the United States with a correlation coefficient (R) of -0.489 and weighted average of $41,276. Similarly, the statistical analysis conducted on geographies consisting of 170,738,706 people shows a mild negative correlation between the proportion of Vietnamese and median female earnings in the United States with a correlation coefficient (R) of -0.388 and weighted average of $40,377, a difference of 2.2%.
Median Female Earnings Correlation Summary
| Measurement | Korean | Vietnamese |
| Minimum | $19,330 | $23,385 |
| Maximum | $48,873 | $66,442 |
| Range | $29,543 | $43,057 |
| Mean | $39,268 | $40,184 |
| Median | $40,570 | $40,448 |
| Interquartile 25% (IQ1) | $36,354 | $34,018 |
| Interquartile 75% (IQ3) | $43,801 | $43,912 |
| Interquartile Range (IQR) | $7,447 | $9,894 |
| Standard Deviation (Sample) | $6,022 | $9,135 |
| Standard Deviation (Population) | $5,995 | $9,072 |
Similar Demographics by Median Female Earnings
Demographics Similar to Koreans by Median Female Earnings
In terms of median female earnings, the demographic groups most similar to Koreans are Immigrants from England ($41,277, a difference of 0.0%), Immigrants from Brazil ($41,273, a difference of 0.010%), Macedonian ($41,286, a difference of 0.020%), Barbadian ($41,261, a difference of 0.040%), and Immigrants from North America ($41,319, a difference of 0.10%).
| Demographics | Rating | Rank | Median Female Earnings |
| Jordanians | 97.5 /100 | #108 | Exceptional $41,464 |
| Chinese | 97.5 /100 | #109 | Exceptional $41,461 |
| Immigrants | Western Asia | 97.0 /100 | #110 | Exceptional $41,375 |
| Immigrants | Canada | 97.0 /100 | #111 | Exceptional $41,373 |
| Immigrants | North America | 96.7 /100 | #112 | Exceptional $41,319 |
| Macedonians | 96.4 /100 | #113 | Exceptional $41,286 |
| Immigrants | England | 96.4 /100 | #114 | Exceptional $41,277 |
| Koreans | 96.4 /100 | #115 | Exceptional $41,276 |
| Immigrants | Brazil | 96.4 /100 | #116 | Exceptional $41,273 |
| Barbadians | 96.3 /100 | #117 | Exceptional $41,261 |
| Immigrants | Lebanon | 95.6 /100 | #118 | Exceptional $41,183 |
| Immigrants | Philippines | 95.0 /100 | #119 | Exceptional $41,114 |
| Immigrants | Kuwait | 94.4 /100 | #120 | Exceptional $41,055 |
| Croatians | 93.7 /100 | #121 | Exceptional $40,993 |
| Immigrants | Jordan | 93.5 /100 | #122 | Exceptional $40,977 |
Demographics Similar to Vietnamese by Median Female Earnings
In terms of median female earnings, the demographic groups most similar to Vietnamese are Polish ($40,371, a difference of 0.020%), Immigrants from Cameroon ($40,354, a difference of 0.060%), Immigrants from Chile ($40,353, a difference of 0.060%), Immigrants from Armenia ($40,340, a difference of 0.090%), and Ghanaian ($40,429, a difference of 0.13%).
| Demographics | Rating | Rank | Median Female Earnings |
| Serbians | 85.2 /100 | #140 | Excellent $40,539 |
| Immigrants | Syria | 84.1 /100 | #141 | Excellent $40,499 |
| Sri Lankans | 84.0 /100 | #142 | Excellent $40,496 |
| Northern Europeans | 83.9 /100 | #143 | Excellent $40,491 |
| Immigrants | North Macedonia | 83.8 /100 | #144 | Excellent $40,488 |
| Brazilians | 83.6 /100 | #145 | Excellent $40,483 |
| Ghanaians | 82.1 /100 | #146 | Excellent $40,429 |
| Vietnamese | 80.4 /100 | #147 | Excellent $40,377 |
| Poles | 80.2 /100 | #148 | Excellent $40,371 |
| Immigrants | Cameroon | 79.7 /100 | #149 | Good $40,354 |
| Immigrants | Chile | 79.6 /100 | #150 | Good $40,353 |
| Immigrants | Armenia | 79.2 /100 | #151 | Good $40,340 |
| West Indians | 78.4 /100 | #152 | Good $40,317 |
| British West Indians | 77.7 /100 | #153 | Good $40,299 |
| Immigrants | Oceania | 77.6 /100 | #154 | Good $40,297 |