Korean vs Immigrants from Canada Median Earnings
COMPARE
Korean
Immigrants from Canada
Median Earnings
Median Earnings Comparison
Koreans
Immigrants from Canada
$48,727
MEDIAN EARNINGS
96.2/ 100
METRIC RATING
116th/ 347
METRIC RANK
$50,192
MEDIAN EARNINGS
99.5/ 100
METRIC RATING
86th/ 347
METRIC RANK
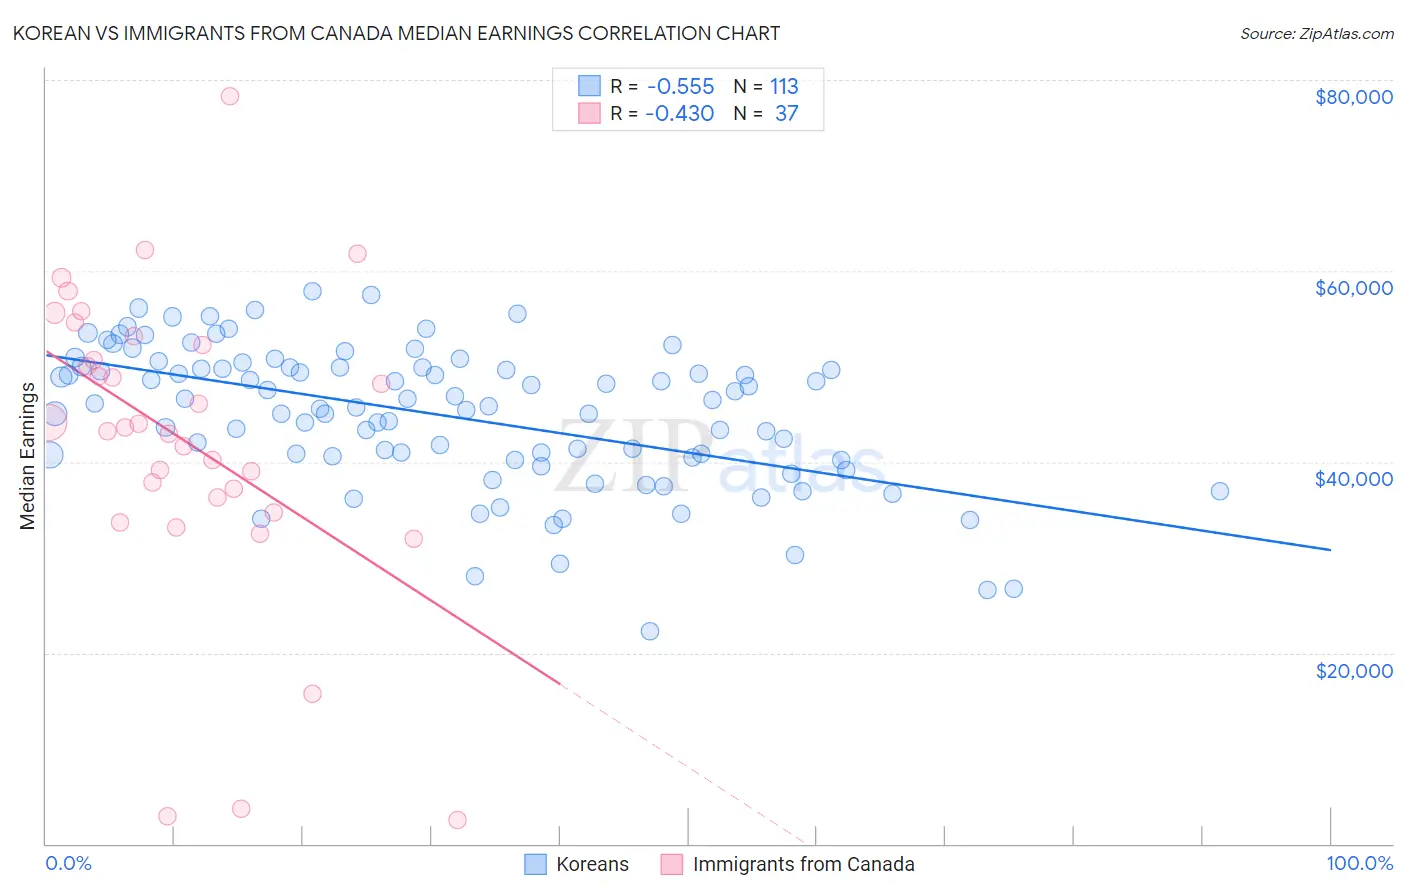
Korean vs Immigrants from Canada Median Earnings Correlation Chart
The statistical analysis conducted on geographies consisting of 510,900,863 people shows a substantial negative correlation between the proportion of Koreans and median earnings in the United States with a correlation coefficient (R) of -0.555 and weighted average of $48,727. Similarly, the statistical analysis conducted on geographies consisting of 459,326,577 people shows a moderate negative correlation between the proportion of Immigrants from Canada and median earnings in the United States with a correlation coefficient (R) of -0.430 and weighted average of $50,192, a difference of 3.0%.
Median Earnings Correlation Summary
| Measurement | Korean | Immigrants from Canada |
| Minimum | $22,216 | $2,499 |
| Maximum | $57,875 | $78,310 |
| Range | $35,659 | $75,811 |
| Mean | $44,924 | $42,254 |
| Median | $46,110 | $43,536 |
| Interquartile 25% (IQ1) | $40,528 | $35,442 |
| Interquartile 75% (IQ3) | $49,935 | $52,692 |
| Interquartile Range (IQR) | $9,407 | $17,250 |
| Standard Deviation (Sample) | $7,353 | $16,214 |
| Standard Deviation (Population) | $7,320 | $15,993 |
Similar Demographics by Median Earnings
Demographics Similar to Koreans by Median Earnings
In terms of median earnings, the demographic groups most similar to Koreans are Serbian ($48,677, a difference of 0.10%), Immigrants from Jordan ($48,673, a difference of 0.11%), Polish ($48,659, a difference of 0.14%), Chinese ($48,836, a difference of 0.22%), and Moroccan ($48,838, a difference of 0.23%).
| Demographics | Rating | Rank | Median Earnings |
| Syrians | 97.1 /100 | #109 | Exceptional $48,934 |
| Immigrants | Ethiopia | 97.1 /100 | #110 | Exceptional $48,924 |
| Immigrants | Zimbabwe | 97.0 /100 | #111 | Exceptional $48,913 |
| Northern Europeans | 96.9 /100 | #112 | Exceptional $48,887 |
| Immigrants | Kuwait | 96.8 /100 | #113 | Exceptional $48,861 |
| Moroccans | 96.7 /100 | #114 | Exceptional $48,838 |
| Chinese | 96.7 /100 | #115 | Exceptional $48,836 |
| Koreans | 96.2 /100 | #116 | Exceptional $48,727 |
| Serbians | 95.9 /100 | #117 | Exceptional $48,677 |
| Immigrants | Jordan | 95.9 /100 | #118 | Exceptional $48,673 |
| Poles | 95.8 /100 | #119 | Exceptional $48,659 |
| Carpatho Rusyns | 95.5 /100 | #120 | Exceptional $48,617 |
| Arabs | 95.4 /100 | #121 | Exceptional $48,599 |
| Chileans | 94.8 /100 | #122 | Exceptional $48,504 |
| Immigrants | Syria | 93.9 /100 | #123 | Exceptional $48,375 |
Demographics Similar to Immigrants from Canada by Median Earnings
In terms of median earnings, the demographic groups most similar to Immigrants from Canada are Immigrants from Hungary ($50,227, a difference of 0.070%), Immigrants from Kazakhstan ($50,225, a difference of 0.070%), Immigrants from Uzbekistan ($50,151, a difference of 0.080%), Romanian ($50,244, a difference of 0.10%), and Albanian ($50,116, a difference of 0.15%).
| Demographics | Rating | Rank | Median Earnings |
| Laotians | 99.6 /100 | #79 | Exceptional $50,343 |
| Ukrainians | 99.6 /100 | #80 | Exceptional $50,320 |
| Immigrants | Southern Europe | 99.6 /100 | #81 | Exceptional $50,280 |
| Immigrants | Moldova | 99.5 /100 | #82 | Exceptional $50,274 |
| Romanians | 99.5 /100 | #83 | Exceptional $50,244 |
| Immigrants | Hungary | 99.5 /100 | #84 | Exceptional $50,227 |
| Immigrants | Kazakhstan | 99.5 /100 | #85 | Exceptional $50,225 |
| Immigrants | Canada | 99.5 /100 | #86 | Exceptional $50,192 |
| Immigrants | Uzbekistan | 99.5 /100 | #87 | Exceptional $50,151 |
| Albanians | 99.4 /100 | #88 | Exceptional $50,116 |
| Immigrants | North America | 99.4 /100 | #89 | Exceptional $50,108 |
| Italians | 99.3 /100 | #90 | Exceptional $49,915 |
| Macedonians | 99.2 /100 | #91 | Exceptional $49,893 |
| Immigrants | Argentina | 99.2 /100 | #92 | Exceptional $49,841 |
| Armenians | 99.1 /100 | #93 | Exceptional $49,804 |