Korean vs Immigrants from Germany Median Earnings
COMPARE
Korean
Immigrants from Germany
Median Earnings
Median Earnings Comparison
Koreans
Immigrants from Germany
$48,727
MEDIAN EARNINGS
96.2/ 100
METRIC RATING
116th/ 347
METRIC RANK
$47,566
MEDIAN EARNINGS
83.1/ 100
METRIC RATING
152nd/ 347
METRIC RANK
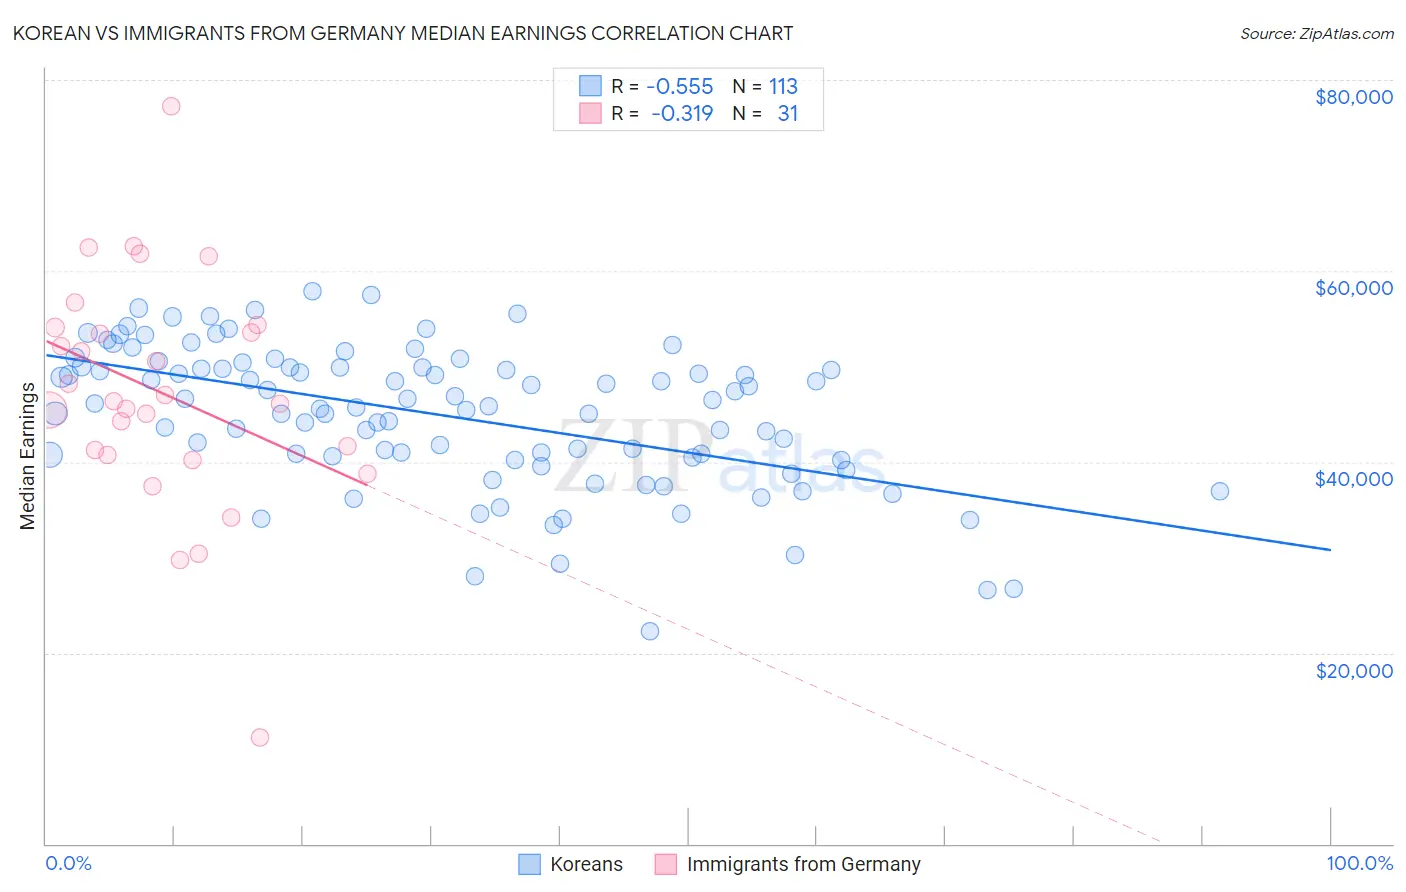
Korean vs Immigrants from Germany Median Earnings Correlation Chart
The statistical analysis conducted on geographies consisting of 510,900,863 people shows a substantial negative correlation between the proportion of Koreans and median earnings in the United States with a correlation coefficient (R) of -0.555 and weighted average of $48,727. Similarly, the statistical analysis conducted on geographies consisting of 463,817,606 people shows a mild negative correlation between the proportion of Immigrants from Germany and median earnings in the United States with a correlation coefficient (R) of -0.319 and weighted average of $47,566, a difference of 2.4%.
Median Earnings Correlation Summary
| Measurement | Korean | Immigrants from Germany |
| Minimum | $22,216 | $11,184 |
| Maximum | $57,875 | $77,202 |
| Range | $35,659 | $66,018 |
| Mean | $44,924 | $47,273 |
| Median | $46,110 | $46,327 |
| Interquartile 25% (IQ1) | $40,528 | $40,729 |
| Interquartile 75% (IQ3) | $49,935 | $54,030 |
| Interquartile Range (IQR) | $9,407 | $13,301 |
| Standard Deviation (Sample) | $7,353 | $12,257 |
| Standard Deviation (Population) | $7,320 | $12,057 |
Similar Demographics by Median Earnings
Demographics Similar to Koreans by Median Earnings
In terms of median earnings, the demographic groups most similar to Koreans are Serbian ($48,677, a difference of 0.10%), Immigrants from Jordan ($48,673, a difference of 0.11%), Polish ($48,659, a difference of 0.14%), Chinese ($48,836, a difference of 0.22%), and Moroccan ($48,838, a difference of 0.23%).
| Demographics | Rating | Rank | Median Earnings |
| Syrians | 97.1 /100 | #109 | Exceptional $48,934 |
| Immigrants | Ethiopia | 97.1 /100 | #110 | Exceptional $48,924 |
| Immigrants | Zimbabwe | 97.0 /100 | #111 | Exceptional $48,913 |
| Northern Europeans | 96.9 /100 | #112 | Exceptional $48,887 |
| Immigrants | Kuwait | 96.8 /100 | #113 | Exceptional $48,861 |
| Moroccans | 96.7 /100 | #114 | Exceptional $48,838 |
| Chinese | 96.7 /100 | #115 | Exceptional $48,836 |
| Koreans | 96.2 /100 | #116 | Exceptional $48,727 |
| Serbians | 95.9 /100 | #117 | Exceptional $48,677 |
| Immigrants | Jordan | 95.9 /100 | #118 | Exceptional $48,673 |
| Poles | 95.8 /100 | #119 | Exceptional $48,659 |
| Carpatho Rusyns | 95.5 /100 | #120 | Exceptional $48,617 |
| Arabs | 95.4 /100 | #121 | Exceptional $48,599 |
| Chileans | 94.8 /100 | #122 | Exceptional $48,504 |
| Immigrants | Syria | 93.9 /100 | #123 | Exceptional $48,375 |
Demographics Similar to Immigrants from Germany by Median Earnings
In terms of median earnings, the demographic groups most similar to Immigrants from Germany are Immigrants from Oceania ($47,617, a difference of 0.11%), Peruvian ($47,628, a difference of 0.13%), Luxembourger ($47,640, a difference of 0.16%), Immigrants from Eritrea ($47,657, a difference of 0.19%), and Slavic ($47,470, a difference of 0.20%).
| Demographics | Rating | Rank | Median Earnings |
| Immigrants | Saudi Arabia | 85.6 /100 | #145 | Excellent $47,704 |
| Immigrants | Chile | 85.5 /100 | #146 | Excellent $47,697 |
| Immigrants | South Eastern Asia | 85.0 /100 | #147 | Excellent $47,671 |
| Immigrants | Eritrea | 84.8 /100 | #148 | Excellent $47,657 |
| Luxembourgers | 84.5 /100 | #149 | Excellent $47,640 |
| Peruvians | 84.2 /100 | #150 | Excellent $47,628 |
| Immigrants | Oceania | 84.1 /100 | #151 | Excellent $47,617 |
| Immigrants | Germany | 83.1 /100 | #152 | Excellent $47,566 |
| Slavs | 81.1 /100 | #153 | Excellent $47,470 |
| Immigrants | Portugal | 77.3 /100 | #154 | Good $47,304 |
| Immigrants | Vietnam | 76.7 /100 | #155 | Good $47,282 |
| Irish | 76.6 /100 | #156 | Good $47,276 |
| Czechs | 75.1 /100 | #157 | Good $47,221 |
| Slovaks | 71.7 /100 | #158 | Good $47,095 |
| Immigrants | Peru | 69.6 /100 | #159 | Good $47,025 |