Kiowa vs Croatian Median Male Earnings
COMPARE
Kiowa
Croatian
Median Male Earnings
Median Male Earnings Comparison
Kiowa
Croatians
$45,094
MEDIAN MALE EARNINGS
0.0/ 100
METRIC RATING
328th/ 347
METRIC RANK
$59,715
MEDIAN MALE EARNINGS
99.4/ 100
METRIC RATING
82nd/ 347
METRIC RANK
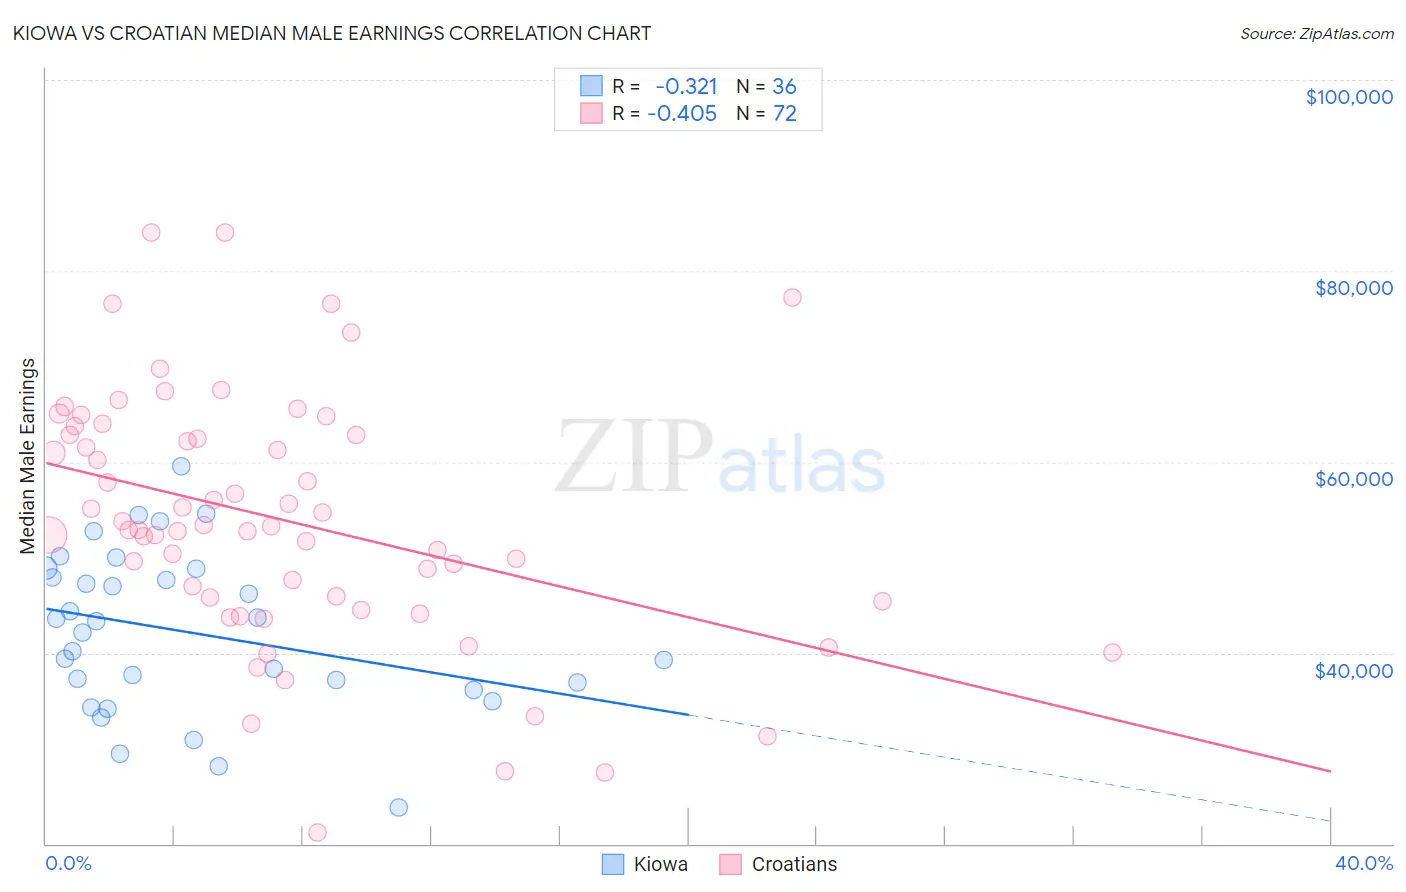
Kiowa vs Croatian Median Male Earnings Correlation Chart
The statistical analysis conducted on geographies consisting of 56,097,810 people shows a mild negative correlation between the proportion of Kiowa and median male earnings in the United States with a correlation coefficient (R) of -0.321 and weighted average of $45,094. Similarly, the statistical analysis conducted on geographies consisting of 375,622,931 people shows a moderate negative correlation between the proportion of Croatians and median male earnings in the United States with a correlation coefficient (R) of -0.405 and weighted average of $59,715, a difference of 32.4%.
Median Male Earnings Correlation Summary
| Measurement | Kiowa | Croatian |
| Minimum | $23,854 | $21,121 |
| Maximum | $59,583 | $84,044 |
| Range | $35,729 | $62,923 |
| Mean | $42,136 | $53,900 |
| Median | $42,718 | $53,037 |
| Interquartile 25% (IQ1) | $36,490 | $45,591 |
| Interquartile 75% (IQ3) | $48,295 | $62,805 |
| Interquartile Range (IQR) | $11,805 | $17,214 |
| Standard Deviation (Sample) | $8,380 | $12,980 |
| Standard Deviation (Population) | $8,263 | $12,890 |
Similar Demographics by Median Male Earnings
Demographics Similar to Kiowa by Median Male Earnings
In terms of median male earnings, the demographic groups most similar to Kiowa are Immigrants from Bahamas ($45,176, a difference of 0.18%), Yakama ($45,002, a difference of 0.20%), Immigrants from Mexico ($44,960, a difference of 0.30%), Immigrants from Haiti ($45,266, a difference of 0.38%), and Native/Alaskan ($44,775, a difference of 0.71%).
| Demographics | Rating | Rank | Median Male Earnings |
| Fijians | 0.0 /100 | #321 | Tragic $45,607 |
| Sioux | 0.0 /100 | #322 | Tragic $45,566 |
| Immigrants | Central America | 0.0 /100 | #323 | Tragic $45,538 |
| Blacks/African Americans | 0.0 /100 | #324 | Tragic $45,523 |
| Yuman | 0.0 /100 | #325 | Tragic $45,446 |
| Immigrants | Haiti | 0.0 /100 | #326 | Tragic $45,266 |
| Immigrants | Bahamas | 0.0 /100 | #327 | Tragic $45,176 |
| Kiowa | 0.0 /100 | #328 | Tragic $45,094 |
| Yakama | 0.0 /100 | #329 | Tragic $45,002 |
| Immigrants | Mexico | 0.0 /100 | #330 | Tragic $44,960 |
| Natives/Alaskans | 0.0 /100 | #331 | Tragic $44,775 |
| Bahamians | 0.0 /100 | #332 | Tragic $44,756 |
| Immigrants | Congo | 0.0 /100 | #333 | Tragic $44,204 |
| Immigrants | Yemen | 0.0 /100 | #334 | Tragic $44,083 |
| Spanish American Indians | 0.0 /100 | #335 | Tragic $44,010 |
Demographics Similar to Croatians by Median Male Earnings
In terms of median male earnings, the demographic groups most similar to Croatians are Ukrainian ($59,728, a difference of 0.020%), Immigrants from Italy ($59,691, a difference of 0.040%), Immigrants from Hungary ($59,806, a difference of 0.15%), Immigrants from Ukraine ($59,820, a difference of 0.18%), and Afghan ($59,554, a difference of 0.27%).
| Demographics | Rating | Rank | Median Male Earnings |
| Immigrants | Bolivia | 99.6 /100 | #75 | Exceptional $60,088 |
| Romanians | 99.6 /100 | #76 | Exceptional $60,063 |
| Paraguayans | 99.5 /100 | #77 | Exceptional $59,975 |
| Immigrants | Egypt | 99.5 /100 | #78 | Exceptional $59,925 |
| Immigrants | Ukraine | 99.5 /100 | #79 | Exceptional $59,820 |
| Immigrants | Hungary | 99.5 /100 | #80 | Exceptional $59,806 |
| Ukrainians | 99.4 /100 | #81 | Exceptional $59,728 |
| Croatians | 99.4 /100 | #82 | Exceptional $59,715 |
| Immigrants | Italy | 99.4 /100 | #83 | Exceptional $59,691 |
| Afghans | 99.3 /100 | #84 | Exceptional $59,554 |
| Italians | 99.3 /100 | #85 | Exceptional $59,551 |
| Immigrants | England | 99.3 /100 | #86 | Exceptional $59,527 |
| Macedonians | 99.3 /100 | #87 | Exceptional $59,522 |
| Immigrants | Argentina | 99.3 /100 | #88 | Exceptional $59,491 |
| Immigrants | Moldova | 99.2 /100 | #89 | Exceptional $59,417 |