Pima vs Assyrian/Chaldean/Syriac Per Capita Income
COMPARE
Pima
Assyrian/Chaldean/Syriac
Per Capita Income
Per Capita Income Comparison
Pima
Assyrians/Chaldeans/Syriacs
$30,644
PER CAPITA INCOME
0.0/ 100
METRIC RATING
343rd/ 347
METRIC RANK
$45,195
PER CAPITA INCOME
84.8/ 100
METRIC RATING
138th/ 347
METRIC RANK
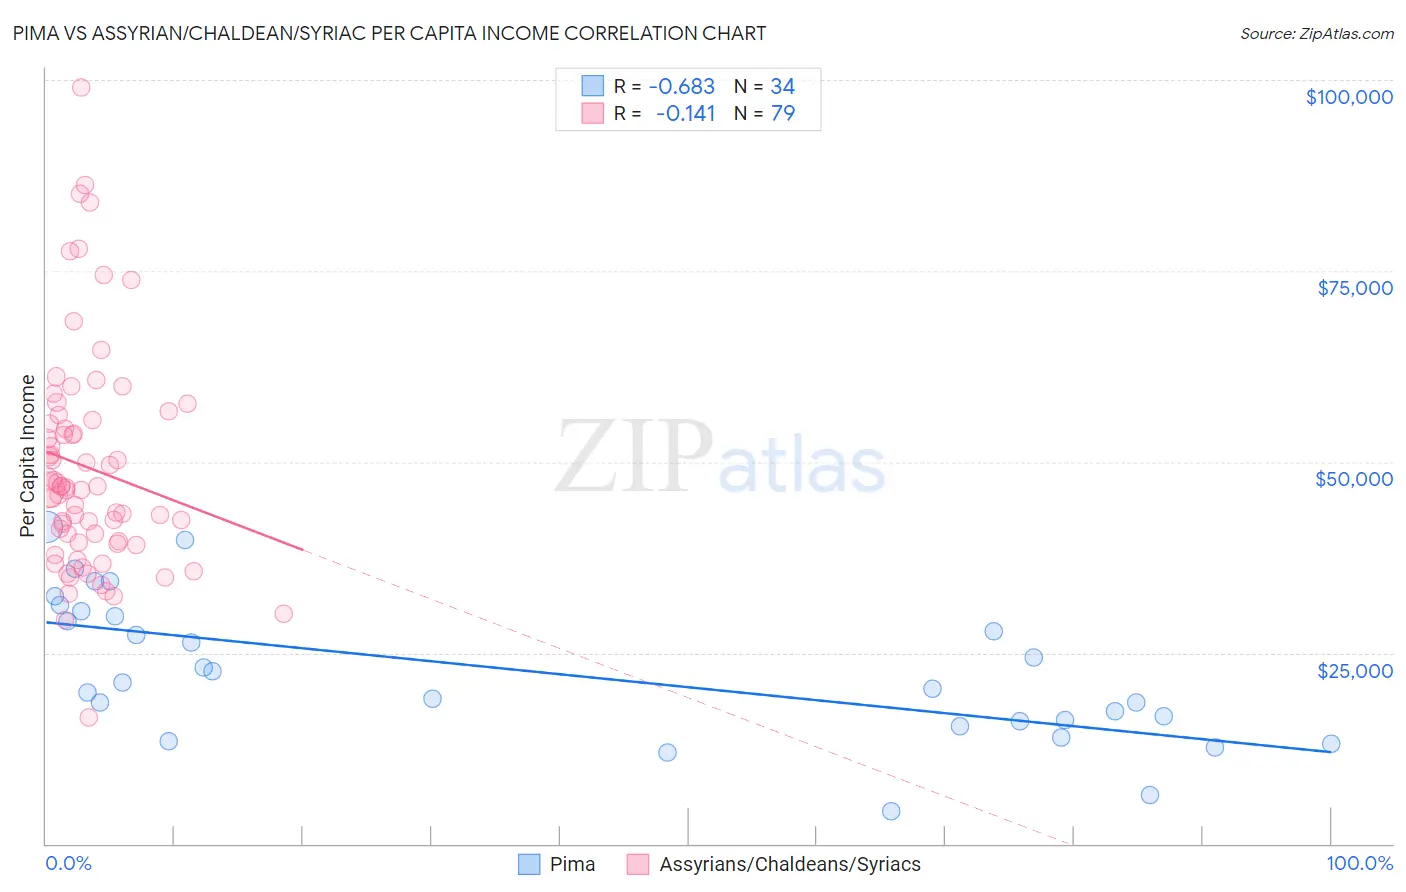
Pima vs Assyrian/Chaldean/Syriac Per Capita Income Correlation Chart
The statistical analysis conducted on geographies consisting of 61,552,682 people shows a significant negative correlation between the proportion of Pima and per capita income in the United States with a correlation coefficient (R) of -0.683 and weighted average of $30,644. Similarly, the statistical analysis conducted on geographies consisting of 110,311,560 people shows a poor negative correlation between the proportion of Assyrians/Chaldeans/Syriacs and per capita income in the United States with a correlation coefficient (R) of -0.141 and weighted average of $45,195, a difference of 47.5%.
Per Capita Income Correlation Summary
| Measurement | Pima | Assyrian/Chaldean/Syriac |
| Minimum | $4,256 | $16,468 |
| Maximum | $41,474 | $99,080 |
| Range | $37,218 | $82,612 |
| Mean | $22,491 | $49,218 |
| Median | $20,723 | $46,715 |
| Interquartile 25% (IQ1) | $16,036 | $39,451 |
| Interquartile 75% (IQ3) | $29,725 | $55,554 |
| Interquartile Range (IQR) | $13,689 | $16,103 |
| Standard Deviation (Sample) | $9,246 | $14,590 |
| Standard Deviation (Population) | $9,109 | $14,497 |
Similar Demographics by Per Capita Income
Demographics Similar to Pima by Per Capita Income
In terms of per capita income, the demographic groups most similar to Pima are Yup'ik ($30,518, a difference of 0.41%), Tohono O'odham ($30,256, a difference of 1.3%), Hopi ($31,177, a difference of 1.7%), Puerto Rican ($31,268, a difference of 2.0%), and Lumbee ($29,845, a difference of 2.7%).
| Demographics | Rating | Rank | Per Capita Income |
| Immigrants | Yemen | 0.0 /100 | #333 | Tragic $33,696 |
| Natives/Alaskans | 0.0 /100 | #334 | Tragic $33,279 |
| Yuman | 0.0 /100 | #335 | Tragic $33,236 |
| Yakama | 0.0 /100 | #336 | Tragic $33,009 |
| Houma | 0.0 /100 | #337 | Tragic $32,996 |
| Arapaho | 0.0 /100 | #338 | Tragic $32,345 |
| Pueblo | 0.0 /100 | #339 | Tragic $32,012 |
| Crow | 0.0 /100 | #340 | Tragic $31,729 |
| Puerto Ricans | 0.0 /100 | #341 | Tragic $31,268 |
| Hopi | 0.0 /100 | #342 | Tragic $31,177 |
| Pima | 0.0 /100 | #343 | Tragic $30,644 |
| Yup'ik | 0.0 /100 | #344 | Tragic $30,518 |
| Tohono O'odham | 0.0 /100 | #345 | Tragic $30,256 |
| Lumbee | 0.0 /100 | #346 | Tragic $29,845 |
| Navajo | 0.0 /100 | #347 | Tragic $29,031 |
Demographics Similar to Assyrians/Chaldeans/Syriacs by Per Capita Income
In terms of per capita income, the demographic groups most similar to Assyrians/Chaldeans/Syriacs are Immigrants from Syria ($45,218, a difference of 0.050%), Immigrants from Oceania ($45,220, a difference of 0.060%), Basque ($45,086, a difference of 0.24%), Immigrants from Jordan ($45,066, a difference of 0.29%), and Slavic ($45,049, a difference of 0.32%).
| Demographics | Rating | Rank | Per Capita Income |
| Immigrants | North Macedonia | 90.0 /100 | #131 | Exceptional $45,622 |
| Jordanians | 89.9 /100 | #132 | Excellent $45,605 |
| Pakistanis | 89.7 /100 | #133 | Excellent $45,587 |
| Slovenes | 89.6 /100 | #134 | Excellent $45,581 |
| Hungarians | 87.9 /100 | #135 | Excellent $45,426 |
| Immigrants | Oceania | 85.2 /100 | #136 | Excellent $45,220 |
| Immigrants | Syria | 85.2 /100 | #137 | Excellent $45,218 |
| Assyrians/Chaldeans/Syriacs | 84.8 /100 | #138 | Excellent $45,195 |
| Basques | 83.2 /100 | #139 | Excellent $45,086 |
| Immigrants | Jordan | 82.9 /100 | #140 | Excellent $45,066 |
| Slavs | 82.6 /100 | #141 | Excellent $45,049 |
| Ugandans | 82.6 /100 | #142 | Excellent $45,047 |
| Immigrants | Uganda | 82.5 /100 | #143 | Excellent $45,043 |
| Icelanders | 81.6 /100 | #144 | Excellent $44,987 |
| Immigrants | Afghanistan | 78.0 /100 | #145 | Good $44,790 |