Immigrants from Egypt vs Assyrian/Chaldean/Syriac Per Capita Income
COMPARE
Immigrants from Egypt
Assyrian/Chaldean/Syriac
Per Capita Income
Per Capita Income Comparison
Immigrants from Egypt
Assyrians/Chaldeans/Syriacs
$47,361
PER CAPITA INCOME
98.5/ 100
METRIC RATING
95th/ 347
METRIC RANK
$45,195
PER CAPITA INCOME
84.8/ 100
METRIC RATING
138th/ 347
METRIC RANK
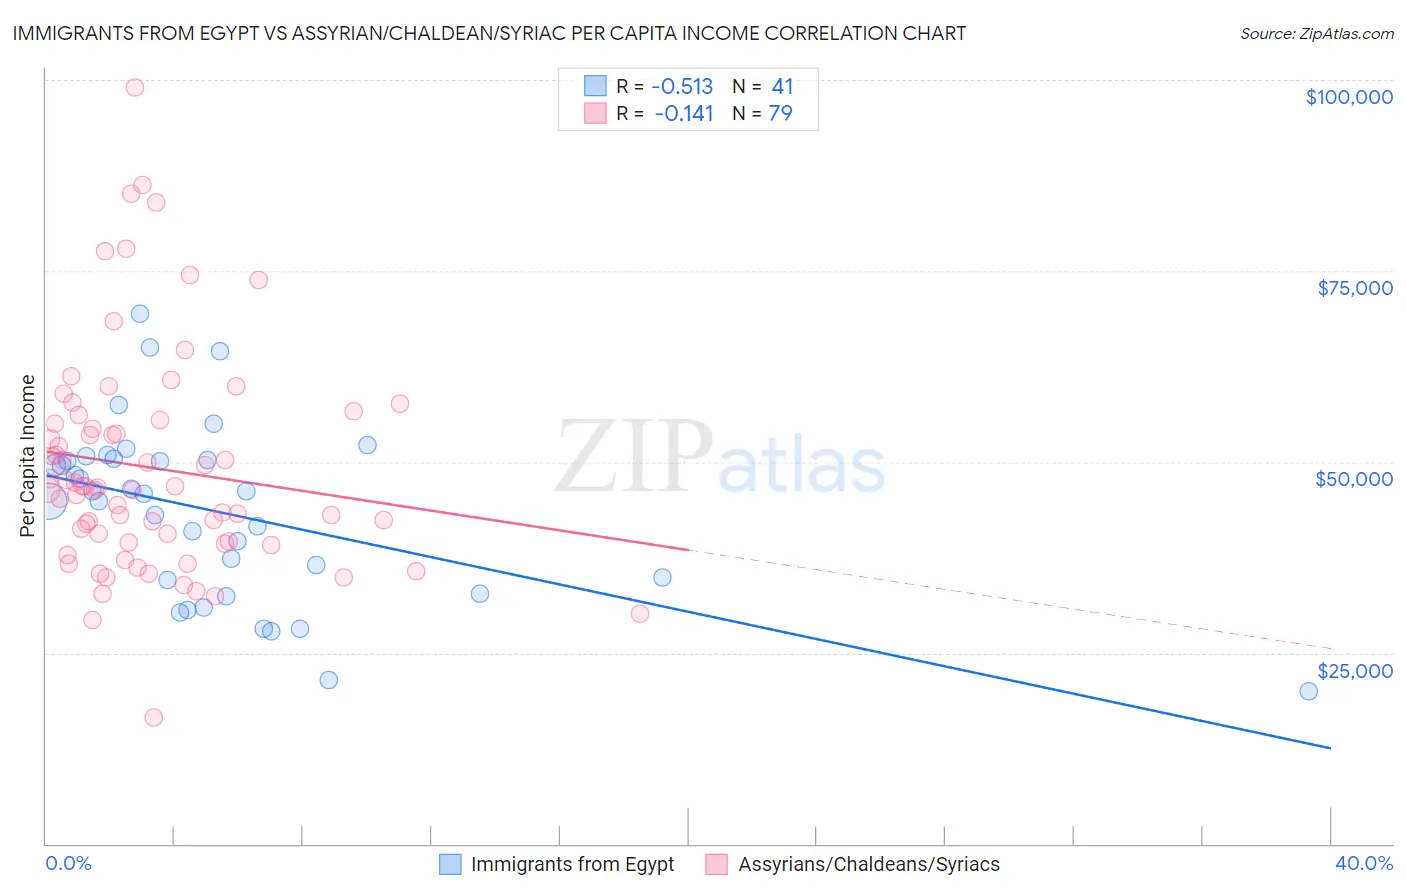
Immigrants from Egypt vs Assyrian/Chaldean/Syriac Per Capita Income Correlation Chart
The statistical analysis conducted on geographies consisting of 245,495,655 people shows a substantial negative correlation between the proportion of Immigrants from Egypt and per capita income in the United States with a correlation coefficient (R) of -0.513 and weighted average of $47,361. Similarly, the statistical analysis conducted on geographies consisting of 110,311,560 people shows a poor negative correlation between the proportion of Assyrians/Chaldeans/Syriacs and per capita income in the United States with a correlation coefficient (R) of -0.141 and weighted average of $45,195, a difference of 4.8%.
Per Capita Income Correlation Summary
| Measurement | Immigrants from Egypt | Assyrian/Chaldean/Syriac |
| Minimum | $19,900 | $16,468 |
| Maximum | $69,371 | $99,080 |
| Range | $49,471 | $82,612 |
| Mean | $43,359 | $49,218 |
| Median | $45,851 | $46,715 |
| Interquartile 25% (IQ1) | $33,676 | $39,451 |
| Interquartile 75% (IQ3) | $50,334 | $55,554 |
| Interquartile Range (IQR) | $16,658 | $16,103 |
| Standard Deviation (Sample) | $11,446 | $14,590 |
| Standard Deviation (Population) | $11,305 | $14,497 |
Similar Demographics by Per Capita Income
Demographics Similar to Immigrants from Egypt by Per Capita Income
In terms of per capita income, the demographic groups most similar to Immigrants from Egypt are Albanian ($47,379, a difference of 0.040%), Immigrants from Zimbabwe ($47,394, a difference of 0.070%), Alsatian ($47,284, a difference of 0.16%), Carpatho Rusyn ($47,248, a difference of 0.24%), and Immigrants from Moldova ($47,489, a difference of 0.27%).
| Demographics | Rating | Rank | Per Capita Income |
| Croatians | 99.0 /100 | #88 | Exceptional $47,742 |
| Northern Europeans | 98.9 /100 | #89 | Exceptional $47,698 |
| Italians | 98.8 /100 | #90 | Exceptional $47,574 |
| Macedonians | 98.8 /100 | #91 | Exceptional $47,573 |
| Immigrants | Moldova | 98.7 /100 | #92 | Exceptional $47,489 |
| Immigrants | Zimbabwe | 98.5 /100 | #93 | Exceptional $47,394 |
| Albanians | 98.5 /100 | #94 | Exceptional $47,379 |
| Immigrants | Egypt | 98.5 /100 | #95 | Exceptional $47,361 |
| Alsatians | 98.3 /100 | #96 | Exceptional $47,284 |
| Carpatho Rusyns | 98.2 /100 | #97 | Exceptional $47,248 |
| Immigrants | Pakistan | 97.9 /100 | #98 | Exceptional $47,084 |
| Laotians | 97.8 /100 | #99 | Exceptional $47,041 |
| Immigrants | Lebanon | 97.5 /100 | #100 | Exceptional $46,938 |
| Immigrants | Uzbekistan | 97.5 /100 | #101 | Exceptional $46,929 |
| Immigrants | Western Asia | 97.4 /100 | #102 | Exceptional $46,876 |
Demographics Similar to Assyrians/Chaldeans/Syriacs by Per Capita Income
In terms of per capita income, the demographic groups most similar to Assyrians/Chaldeans/Syriacs are Immigrants from Syria ($45,218, a difference of 0.050%), Immigrants from Oceania ($45,220, a difference of 0.060%), Basque ($45,086, a difference of 0.24%), Immigrants from Jordan ($45,066, a difference of 0.29%), and Slavic ($45,049, a difference of 0.32%).
| Demographics | Rating | Rank | Per Capita Income |
| Immigrants | North Macedonia | 90.0 /100 | #131 | Exceptional $45,622 |
| Jordanians | 89.9 /100 | #132 | Excellent $45,605 |
| Pakistanis | 89.7 /100 | #133 | Excellent $45,587 |
| Slovenes | 89.6 /100 | #134 | Excellent $45,581 |
| Hungarians | 87.9 /100 | #135 | Excellent $45,426 |
| Immigrants | Oceania | 85.2 /100 | #136 | Excellent $45,220 |
| Immigrants | Syria | 85.2 /100 | #137 | Excellent $45,218 |
| Assyrians/Chaldeans/Syriacs | 84.8 /100 | #138 | Excellent $45,195 |
| Basques | 83.2 /100 | #139 | Excellent $45,086 |
| Immigrants | Jordan | 82.9 /100 | #140 | Excellent $45,066 |
| Slavs | 82.6 /100 | #141 | Excellent $45,049 |
| Ugandans | 82.6 /100 | #142 | Excellent $45,047 |
| Immigrants | Uganda | 82.5 /100 | #143 | Excellent $45,043 |
| Icelanders | 81.6 /100 | #144 | Excellent $44,987 |
| Immigrants | Afghanistan | 78.0 /100 | #145 | Good $44,790 |