Jordanian vs Immigrants from Barbados Median Family Income
COMPARE
Jordanian
Immigrants from Barbados
Median Family Income
Median Family Income Comparison
Jordanians
Immigrants from Barbados
$109,865
MEDIAN FAMILY INCOME
97.5/ 100
METRIC RATING
97th/ 347
METRIC RANK
$92,419
MEDIAN FAMILY INCOME
0.5/ 100
METRIC RATING
254th/ 347
METRIC RANK
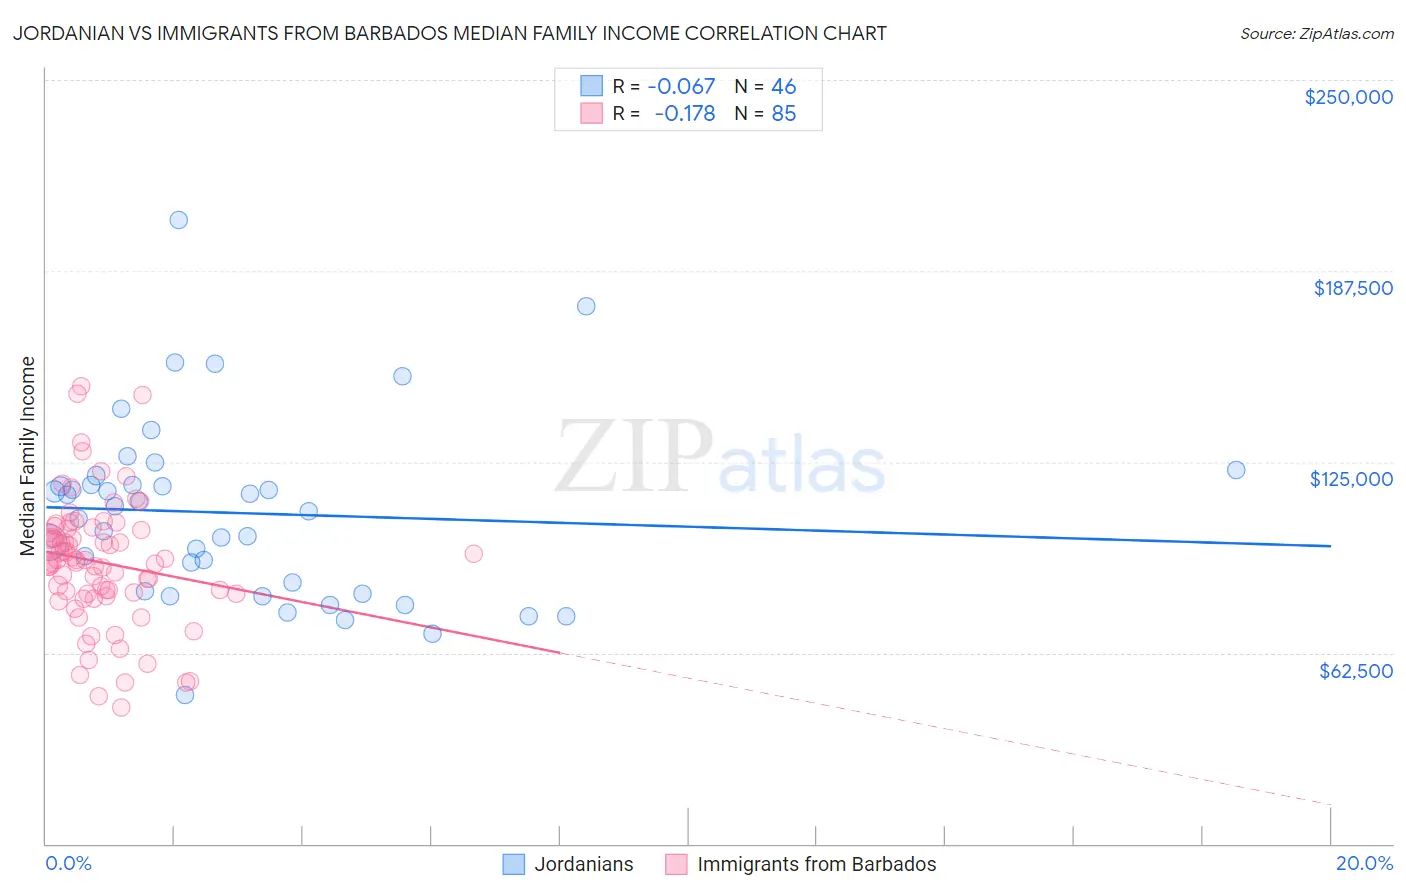
Jordanian vs Immigrants from Barbados Median Family Income Correlation Chart
The statistical analysis conducted on geographies consisting of 166,350,373 people shows a slight negative correlation between the proportion of Jordanians and median family income in the United States with a correlation coefficient (R) of -0.067 and weighted average of $109,865. Similarly, the statistical analysis conducted on geographies consisting of 112,740,718 people shows a poor negative correlation between the proportion of Immigrants from Barbados and median family income in the United States with a correlation coefficient (R) of -0.178 and weighted average of $92,419, a difference of 18.9%.
Median Family Income Correlation Summary
| Measurement | Jordanian | Immigrants from Barbados |
| Minimum | $48,661 | $44,554 |
| Maximum | $204,272 | $149,653 |
| Range | $155,611 | $105,099 |
| Mean | $108,250 | $92,071 |
| Median | $109,650 | $92,856 |
| Interquartile 25% (IQ1) | $82,841 | $81,708 |
| Interquartile 75% (IQ3) | $117,365 | $103,000 |
| Interquartile Range (IQR) | $34,524 | $21,293 |
| Standard Deviation (Sample) | $29,858 | $20,843 |
| Standard Deviation (Population) | $29,532 | $20,721 |
Similar Demographics by Median Family Income
Demographics Similar to Jordanians by Median Family Income
In terms of median family income, the demographic groups most similar to Jordanians are Immigrants from Moldova ($109,975, a difference of 0.10%), Immigrants from Kuwait ($109,731, a difference of 0.12%), Zimbabwean ($110,011, a difference of 0.13%), Armenian ($109,692, a difference of 0.16%), and Macedonian ($109,668, a difference of 0.18%).
| Demographics | Rating | Rank | Median Family Income |
| Northern Europeans | 98.3 /100 | #90 | Exceptional $110,635 |
| Immigrants | Southern Europe | 98.3 /100 | #91 | Exceptional $110,614 |
| Immigrants | Lebanon | 97.9 /100 | #92 | Exceptional $110,159 |
| Immigrants | Kazakhstan | 97.8 /100 | #93 | Exceptional $110,137 |
| Koreans | 97.8 /100 | #94 | Exceptional $110,103 |
| Zimbabweans | 97.7 /100 | #95 | Exceptional $110,011 |
| Immigrants | Moldova | 97.7 /100 | #96 | Exceptional $109,975 |
| Jordanians | 97.5 /100 | #97 | Exceptional $109,865 |
| Immigrants | Kuwait | 97.4 /100 | #98 | Exceptional $109,731 |
| Armenians | 97.3 /100 | #99 | Exceptional $109,692 |
| Macedonians | 97.3 /100 | #100 | Exceptional $109,668 |
| Immigrants | Ukraine | 97.2 /100 | #101 | Exceptional $109,645 |
| Assyrians/Chaldeans/Syriacs | 97.2 /100 | #102 | Exceptional $109,622 |
| Immigrants | Brazil | 96.9 /100 | #103 | Exceptional $109,418 |
| Palestinians | 96.9 /100 | #104 | Exceptional $109,413 |
Demographics Similar to Immigrants from Barbados by Median Family Income
In terms of median family income, the demographic groups most similar to Immigrants from Barbados are Immigrants from Guyana ($92,513, a difference of 0.10%), Immigrants from El Salvador ($92,545, a difference of 0.14%), Immigrants from Laos ($92,239, a difference of 0.20%), Nicaraguan ($92,231, a difference of 0.20%), and Immigrants from Somalia ($92,609, a difference of 0.21%).
| Demographics | Rating | Rank | Median Family Income |
| Immigrants | Senegal | 0.7 /100 | #247 | Tragic $92,912 |
| French American Indians | 0.7 /100 | #248 | Tragic $92,872 |
| Immigrants | Ecuador | 0.7 /100 | #249 | Tragic $92,837 |
| West Indians | 0.6 /100 | #250 | Tragic $92,765 |
| Immigrants | Somalia | 0.6 /100 | #251 | Tragic $92,609 |
| Immigrants | El Salvador | 0.6 /100 | #252 | Tragic $92,545 |
| Immigrants | Guyana | 0.6 /100 | #253 | Tragic $92,513 |
| Immigrants | Barbados | 0.5 /100 | #254 | Tragic $92,419 |
| Immigrants | Laos | 0.5 /100 | #255 | Tragic $92,239 |
| Nicaraguans | 0.5 /100 | #256 | Tragic $92,231 |
| Americans | 0.4 /100 | #257 | Tragic $92,096 |
| Osage | 0.4 /100 | #258 | Tragic $91,926 |
| Cape Verdeans | 0.4 /100 | #259 | Tragic $91,848 |
| Pennsylvania Germans | 0.4 /100 | #260 | Tragic $91,763 |
| Inupiat | 0.4 /100 | #261 | Tragic $91,730 |