Jordanian vs Danish Median Female Earnings
COMPARE
Jordanian
Danish
Median Female Earnings
Median Female Earnings Comparison
Jordanians
Danes
$41,464
MEDIAN FEMALE EARNINGS
97.5/ 100
METRIC RATING
108th/ 347
METRIC RANK
$37,730
MEDIAN FEMALE EARNINGS
1.6/ 100
METRIC RATING
253rd/ 347
METRIC RANK
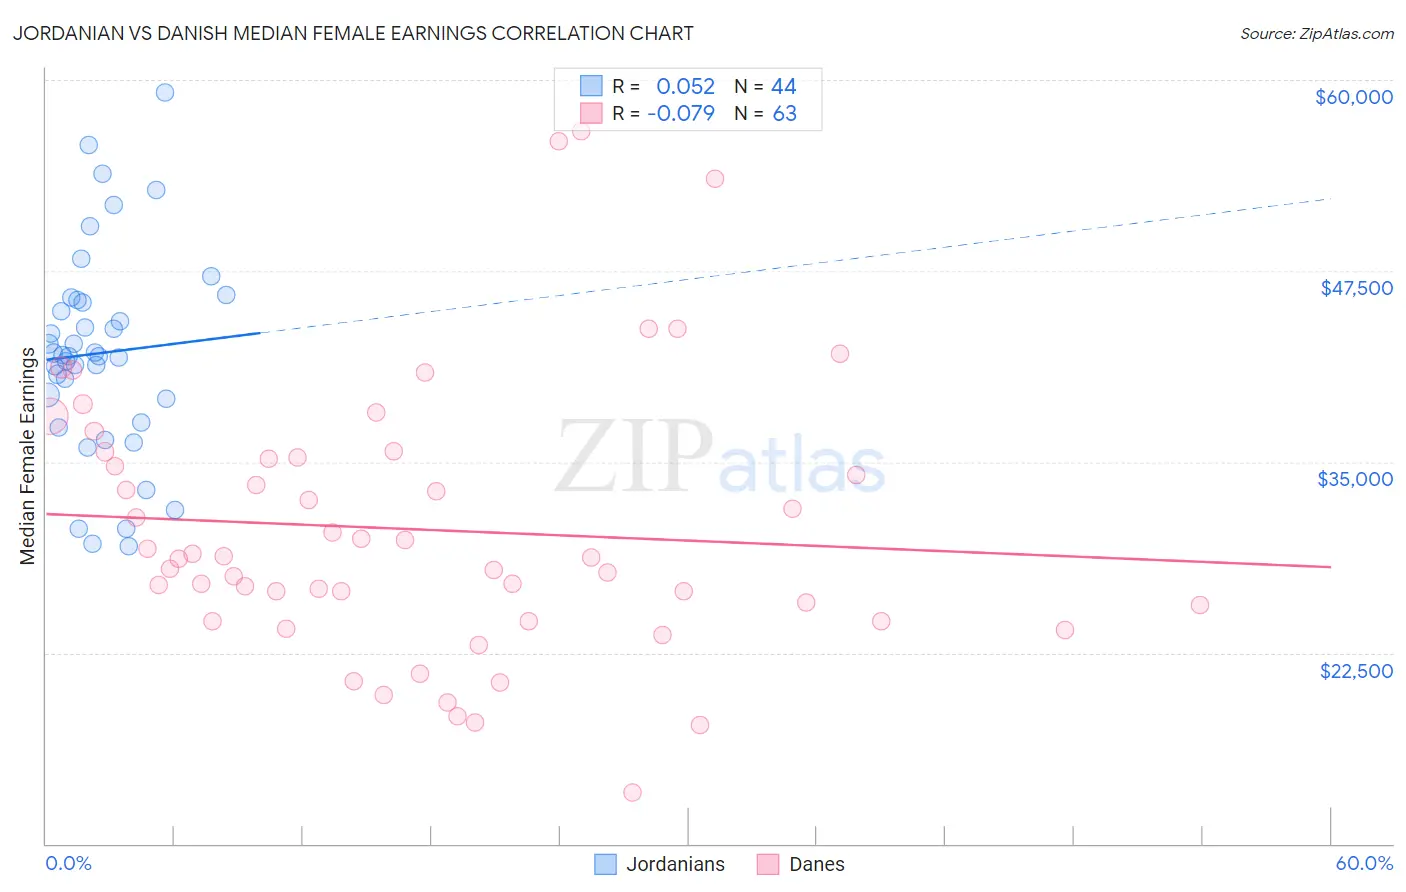
Jordanian vs Danish Median Female Earnings Correlation Chart
The statistical analysis conducted on geographies consisting of 166,394,093 people shows a slight positive correlation between the proportion of Jordanians and median female earnings in the United States with a correlation coefficient (R) of 0.052 and weighted average of $41,464. Similarly, the statistical analysis conducted on geographies consisting of 473,573,147 people shows a slight negative correlation between the proportion of Danes and median female earnings in the United States with a correlation coefficient (R) of -0.079 and weighted average of $37,730, a difference of 9.9%.
Median Female Earnings Correlation Summary
| Measurement | Jordanian | Danish |
| Minimum | $29,450 | $13,388 |
| Maximum | $59,183 | $56,667 |
| Range | $29,733 | $43,279 |
| Mean | $42,125 | $30,568 |
| Median | $41,963 | $28,750 |
| Interquartile 25% (IQ1) | $38,328 | $24,607 |
| Interquartile 75% (IQ3) | $45,509 | $35,286 |
| Interquartile Range (IQR) | $7,181 | $10,679 |
| Standard Deviation (Sample) | $6,763 | $8,841 |
| Standard Deviation (Population) | $6,685 | $8,771 |
Similar Demographics by Median Female Earnings
Demographics Similar to Jordanians by Median Female Earnings
In terms of median female earnings, the demographic groups most similar to Jordanians are Chinese ($41,461, a difference of 0.010%), Immigrants from Eritrea ($41,485, a difference of 0.050%), Palestinian ($41,484, a difference of 0.050%), Italian ($41,505, a difference of 0.10%), and Immigrants from Zimbabwe ($41,527, a difference of 0.15%).
| Demographics | Rating | Rank | Median Female Earnings |
| Immigrants | Fiji | 98.3 /100 | #101 | Exceptional $41,656 |
| Immigrants | Poland | 98.2 /100 | #102 | Exceptional $41,630 |
| Immigrants | Argentina | 97.9 /100 | #103 | Exceptional $41,554 |
| Immigrants | Zimbabwe | 97.8 /100 | #104 | Exceptional $41,527 |
| Italians | 97.7 /100 | #105 | Exceptional $41,505 |
| Immigrants | Eritrea | 97.6 /100 | #106 | Exceptional $41,485 |
| Palestinians | 97.6 /100 | #107 | Exceptional $41,484 |
| Jordanians | 97.5 /100 | #108 | Exceptional $41,464 |
| Chinese | 97.5 /100 | #109 | Exceptional $41,461 |
| Immigrants | Western Asia | 97.0 /100 | #110 | Exceptional $41,375 |
| Immigrants | Canada | 97.0 /100 | #111 | Exceptional $41,373 |
| Immigrants | North America | 96.7 /100 | #112 | Exceptional $41,319 |
| Macedonians | 96.4 /100 | #113 | Exceptional $41,286 |
| Immigrants | England | 96.4 /100 | #114 | Exceptional $41,277 |
| Koreans | 96.4 /100 | #115 | Exceptional $41,276 |
Demographics Similar to Danes by Median Female Earnings
In terms of median female earnings, the demographic groups most similar to Danes are Immigrants from Dominica ($37,825, a difference of 0.25%), Welsh ($37,856, a difference of 0.33%), Immigrants from Iraq ($37,864, a difference of 0.35%), Alaskan Athabascan ($37,905, a difference of 0.46%), and Swiss ($37,904, a difference of 0.46%).
| Demographics | Rating | Rank | Median Female Earnings |
| Delaware | 2.6 /100 | #246 | Tragic $37,964 |
| Immigrants | Somalia | 2.4 /100 | #247 | Tragic $37,914 |
| Alaskan Athabascans | 2.3 /100 | #248 | Tragic $37,905 |
| Swiss | 2.3 /100 | #249 | Tragic $37,904 |
| Immigrants | Iraq | 2.2 /100 | #250 | Tragic $37,864 |
| Welsh | 2.1 /100 | #251 | Tragic $37,856 |
| Immigrants | Dominica | 2.0 /100 | #252 | Tragic $37,825 |
| Danes | 1.6 /100 | #253 | Tragic $37,730 |
| Whites/Caucasians | 1.1 /100 | #254 | Tragic $37,531 |
| Colville | 1.1 /100 | #255 | Tragic $37,514 |
| Samoans | 1.0 /100 | #256 | Tragic $37,498 |
| Hawaiians | 1.0 /100 | #257 | Tragic $37,497 |
| Belizeans | 0.9 /100 | #258 | Tragic $37,429 |
| Scotch-Irish | 0.8 /100 | #259 | Tragic $37,383 |
| Dutch | 0.7 /100 | #260 | Tragic $37,339 |