Jordanian vs Laotian Median Female Earnings
COMPARE
Jordanian
Laotian
Median Female Earnings
Median Female Earnings Comparison
Jordanians
Laotians
$41,464
MEDIAN FEMALE EARNINGS
97.5/ 100
METRIC RATING
108th/ 347
METRIC RANK
$42,133
MEDIAN FEMALE EARNINGS
99.4/ 100
METRIC RATING
85th/ 347
METRIC RANK
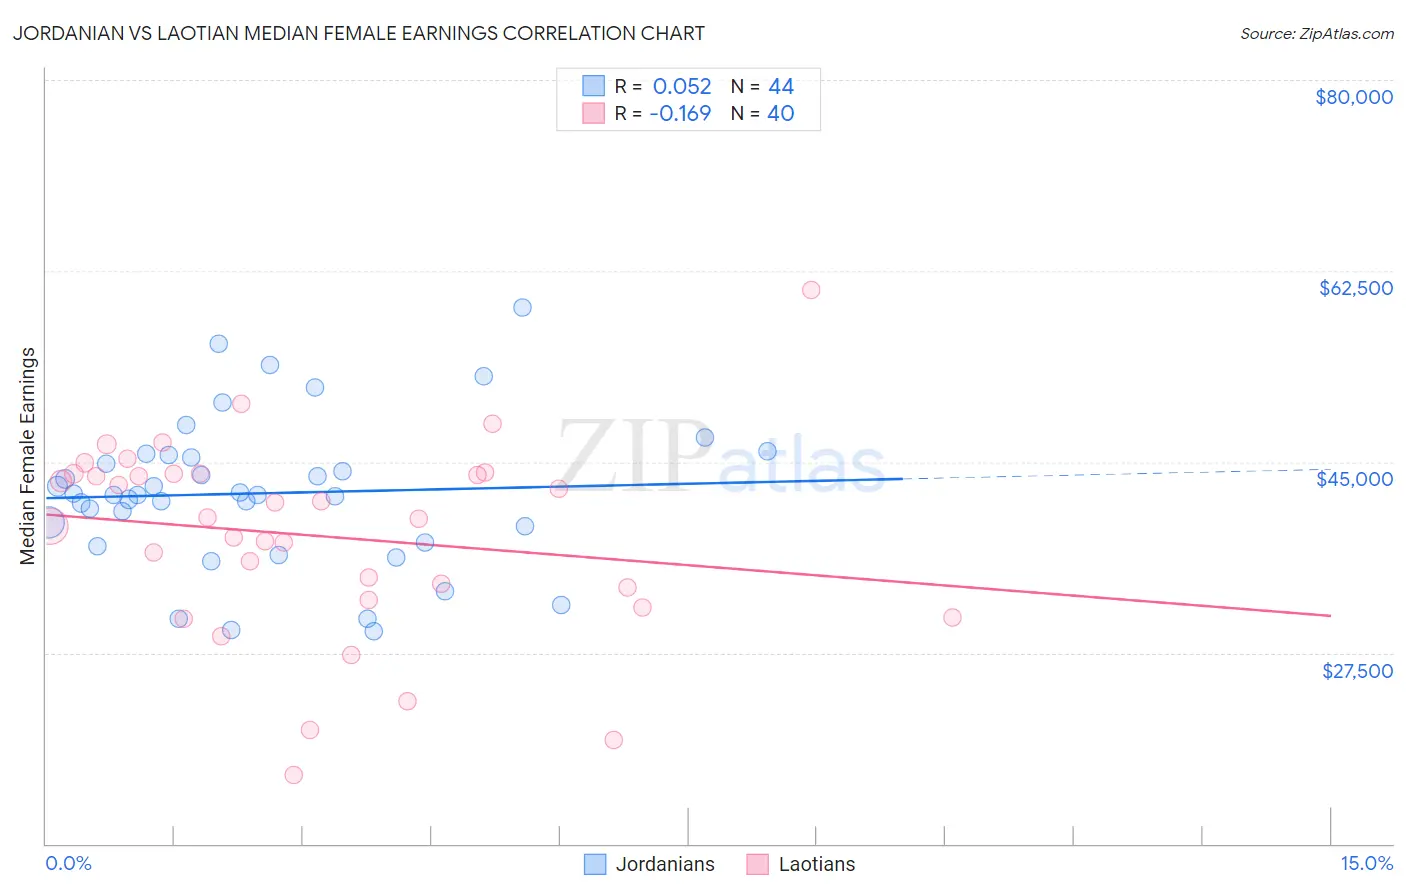
Jordanian vs Laotian Median Female Earnings Correlation Chart
The statistical analysis conducted on geographies consisting of 166,394,093 people shows a slight positive correlation between the proportion of Jordanians and median female earnings in the United States with a correlation coefficient (R) of 0.052 and weighted average of $41,464. Similarly, the statistical analysis conducted on geographies consisting of 224,815,855 people shows a poor negative correlation between the proportion of Laotians and median female earnings in the United States with a correlation coefficient (R) of -0.169 and weighted average of $42,133, a difference of 1.6%.
Median Female Earnings Correlation Summary
| Measurement | Jordanian | Laotian |
| Minimum | $29,450 | $16,291 |
| Maximum | $59,183 | $60,722 |
| Range | $29,733 | $44,431 |
| Mean | $42,125 | $38,224 |
| Median | $41,963 | $39,876 |
| Interquartile 25% (IQ1) | $38,328 | $32,877 |
| Interquartile 75% (IQ3) | $45,509 | $43,879 |
| Interquartile Range (IQR) | $7,181 | $11,002 |
| Standard Deviation (Sample) | $6,763 | $8,986 |
| Standard Deviation (Population) | $6,685 | $8,873 |
Similar Demographics by Median Female Earnings
Demographics Similar to Jordanians by Median Female Earnings
In terms of median female earnings, the demographic groups most similar to Jordanians are Chinese ($41,461, a difference of 0.010%), Immigrants from Eritrea ($41,485, a difference of 0.050%), Palestinian ($41,484, a difference of 0.050%), Italian ($41,505, a difference of 0.10%), and Immigrants from Zimbabwe ($41,527, a difference of 0.15%).
| Demographics | Rating | Rank | Median Female Earnings |
| Immigrants | Fiji | 98.3 /100 | #101 | Exceptional $41,656 |
| Immigrants | Poland | 98.2 /100 | #102 | Exceptional $41,630 |
| Immigrants | Argentina | 97.9 /100 | #103 | Exceptional $41,554 |
| Immigrants | Zimbabwe | 97.8 /100 | #104 | Exceptional $41,527 |
| Italians | 97.7 /100 | #105 | Exceptional $41,505 |
| Immigrants | Eritrea | 97.6 /100 | #106 | Exceptional $41,485 |
| Palestinians | 97.6 /100 | #107 | Exceptional $41,484 |
| Jordanians | 97.5 /100 | #108 | Exceptional $41,464 |
| Chinese | 97.5 /100 | #109 | Exceptional $41,461 |
| Immigrants | Western Asia | 97.0 /100 | #110 | Exceptional $41,375 |
| Immigrants | Canada | 97.0 /100 | #111 | Exceptional $41,373 |
| Immigrants | North America | 96.7 /100 | #112 | Exceptional $41,319 |
| Macedonians | 96.4 /100 | #113 | Exceptional $41,286 |
| Immigrants | England | 96.4 /100 | #114 | Exceptional $41,277 |
| Koreans | 96.4 /100 | #115 | Exceptional $41,276 |
Demographics Similar to Laotians by Median Female Earnings
In terms of median female earnings, the demographic groups most similar to Laotians are Immigrants from St. Vincent and the Grenadines ($42,108, a difference of 0.060%), Lithuanian ($42,108, a difference of 0.060%), Immigrants from Northern Africa ($42,084, a difference of 0.12%), Immigrants from Afghanistan ($42,055, a difference of 0.18%), and Immigrants from Sierra Leone ($42,214, a difference of 0.19%).
| Demographics | Rating | Rank | Median Female Earnings |
| Immigrants | Kazakhstan | 99.6 /100 | #78 | Exceptional $42,386 |
| Greeks | 99.6 /100 | #79 | Exceptional $42,336 |
| Immigrants | Moldova | 99.6 /100 | #80 | Exceptional $42,304 |
| Immigrants | Southern Europe | 99.5 /100 | #81 | Exceptional $42,275 |
| Immigrants | Morocco | 99.5 /100 | #82 | Exceptional $42,229 |
| Immigrants | Sierra Leone | 99.5 /100 | #83 | Exceptional $42,214 |
| Armenians | 99.5 /100 | #84 | Exceptional $42,212 |
| Laotians | 99.4 /100 | #85 | Exceptional $42,133 |
| Immigrants | St. Vincent and the Grenadines | 99.3 /100 | #86 | Exceptional $42,108 |
| Lithuanians | 99.3 /100 | #87 | Exceptional $42,108 |
| Immigrants | Northern Africa | 99.3 /100 | #88 | Exceptional $42,084 |
| Immigrants | Afghanistan | 99.3 /100 | #89 | Exceptional $42,055 |
| Ukrainians | 99.2 /100 | #90 | Exceptional $42,015 |
| Immigrants | Western Europe | 99.2 /100 | #91 | Exceptional $41,990 |
| Argentineans | 99.1 /100 | #92 | Exceptional $41,952 |