Taiwanese vs Blackfeet Median Household Income
COMPARE
Taiwanese
Blackfeet
Median Household Income
Median Household Income Comparison
Taiwanese
Blackfeet
$89,900
MEDIAN HOUSEHOLD INCOME
95.6/ 100
METRIC RATING
117th/ 347
METRIC RANK
$73,509
MEDIAN HOUSEHOLD INCOME
0.1/ 100
METRIC RATING
294th/ 347
METRIC RANK
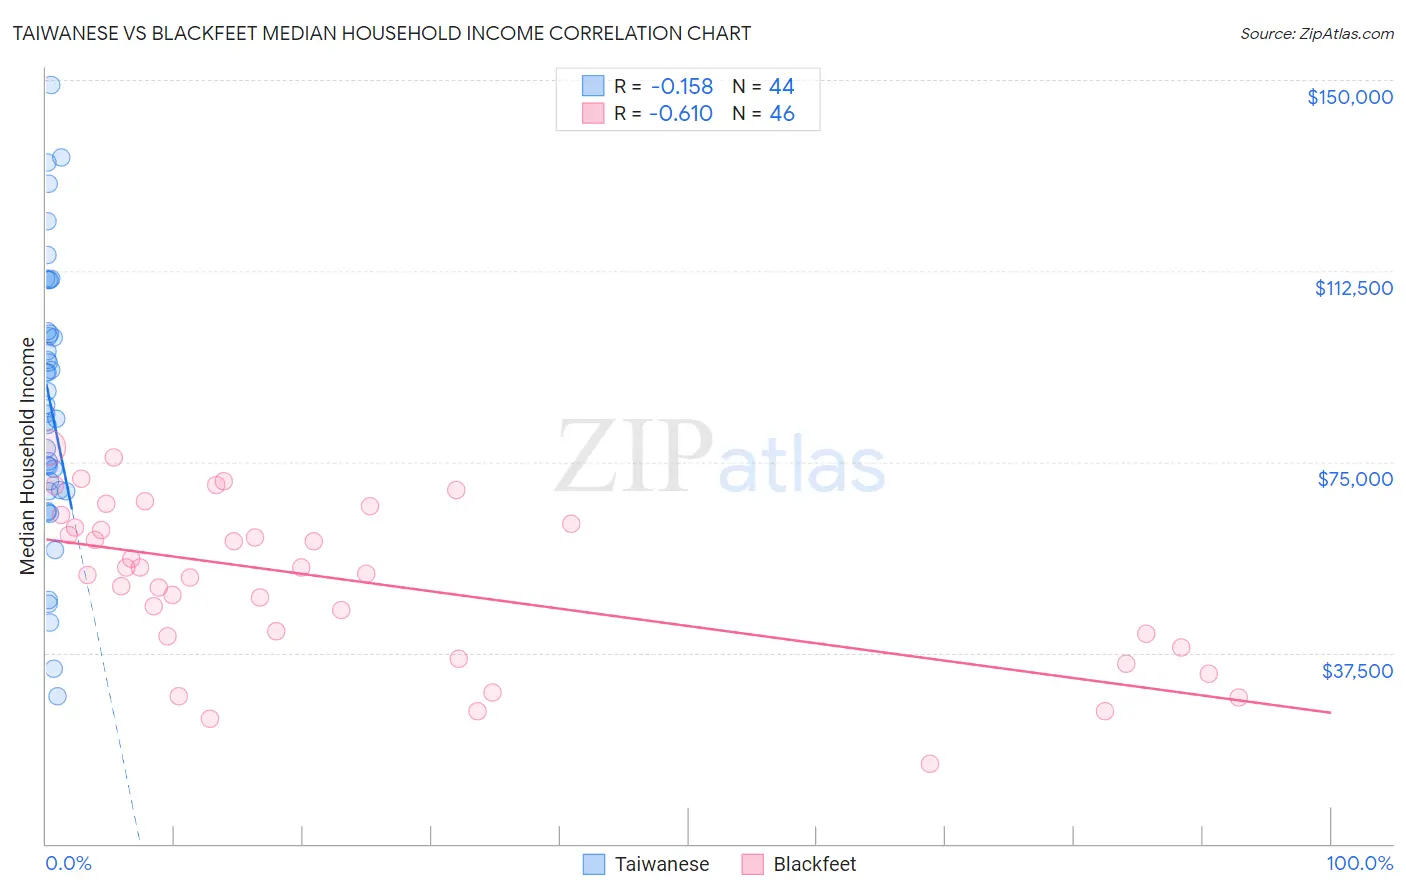
Taiwanese vs Blackfeet Median Household Income Correlation Chart
The statistical analysis conducted on geographies consisting of 31,709,765 people shows a poor negative correlation between the proportion of Taiwanese and median household income in the United States with a correlation coefficient (R) of -0.158 and weighted average of $89,900. Similarly, the statistical analysis conducted on geographies consisting of 309,432,508 people shows a significant negative correlation between the proportion of Blackfeet and median household income in the United States with a correlation coefficient (R) of -0.610 and weighted average of $73,509, a difference of 22.3%.
Median Household Income Correlation Summary
| Measurement | Taiwanese | Blackfeet |
| Minimum | $29,038 | $15,625 |
| Maximum | $149,028 | $77,855 |
| Range | $119,990 | $62,230 |
| Mean | $86,573 | $51,582 |
| Median | $85,327 | $53,641 |
| Interquartile 25% (IQ1) | $69,445 | $40,750 |
| Interquartile 75% (IQ3) | $100,383 | $62,870 |
| Interquartile Range (IQR) | $30,938 | $22,120 |
| Standard Deviation (Sample) | $26,800 | $15,583 |
| Standard Deviation (Population) | $26,494 | $15,413 |
Similar Demographics by Median Household Income
Demographics Similar to Taiwanese by Median Household Income
In terms of median household income, the demographic groups most similar to Taiwanese are Native Hawaiian ($89,919, a difference of 0.020%), Syrian ($89,830, a difference of 0.080%), Immigrants from Western Asia ($90,005, a difference of 0.12%), Immigrants from Northern Africa ($90,026, a difference of 0.14%), and Albanian ($89,744, a difference of 0.17%).
| Demographics | Rating | Rank | Median Household Income |
| Palestinians | 97.1 /100 | #110 | Exceptional $90,574 |
| Immigrants | Poland | 97.1 /100 | #111 | Exceptional $90,549 |
| Northern Europeans | 96.9 /100 | #112 | Exceptional $90,446 |
| Peruvians | 96.5 /100 | #113 | Exceptional $90,261 |
| Immigrants | Northern Africa | 95.9 /100 | #114 | Exceptional $90,026 |
| Immigrants | Western Asia | 95.9 /100 | #115 | Exceptional $90,005 |
| Native Hawaiians | 95.7 /100 | #116 | Exceptional $89,919 |
| Taiwanese | 95.6 /100 | #117 | Exceptional $89,900 |
| Syrians | 95.4 /100 | #118 | Exceptional $89,830 |
| Albanians | 95.2 /100 | #119 | Exceptional $89,744 |
| Immigrants | North Macedonia | 95.2 /100 | #120 | Exceptional $89,741 |
| Ethiopians | 94.9 /100 | #121 | Exceptional $89,640 |
| Pakistanis | 94.8 /100 | #122 | Exceptional $89,638 |
| Immigrants | Zimbabwe | 94.4 /100 | #123 | Exceptional $89,496 |
| Immigrants | Jordan | 94.1 /100 | #124 | Exceptional $89,412 |
Demographics Similar to Blackfeet by Median Household Income
In terms of median household income, the demographic groups most similar to Blackfeet are Immigrants from Cabo Verde ($73,515, a difference of 0.010%), Cuban ($73,392, a difference of 0.16%), Haitian ($73,306, a difference of 0.28%), Comanche ($73,747, a difference of 0.32%), and Hispanic or Latino ($73,823, a difference of 0.43%).
| Demographics | Rating | Rank | Median Household Income |
| Iroquois | 0.1 /100 | #287 | Tragic $74,279 |
| Immigrants | Central America | 0.1 /100 | #288 | Tragic $74,217 |
| Fijians | 0.1 /100 | #289 | Tragic $74,205 |
| Bangladeshis | 0.1 /100 | #290 | Tragic $74,112 |
| Hispanics or Latinos | 0.1 /100 | #291 | Tragic $73,823 |
| Comanche | 0.1 /100 | #292 | Tragic $73,747 |
| Immigrants | Cabo Verde | 0.1 /100 | #293 | Tragic $73,515 |
| Blackfeet | 0.1 /100 | #294 | Tragic $73,509 |
| Cubans | 0.1 /100 | #295 | Tragic $73,392 |
| Haitians | 0.1 /100 | #296 | Tragic $73,306 |
| Immigrants | Mexico | 0.0 /100 | #297 | Tragic $73,160 |
| Paiute | 0.0 /100 | #298 | Tragic $72,959 |
| Indonesians | 0.0 /100 | #299 | Tragic $72,856 |
| Immigrants | Dominica | 0.0 /100 | #300 | Tragic $72,760 |
| Cherokee | 0.0 /100 | #301 | Tragic $72,682 |