Israeli vs Blackfeet Median Household Income
COMPARE
Israeli
Blackfeet
Median Household Income
Median Household Income Comparison
Israelis
Blackfeet
$96,552
MEDIAN HOUSEHOLD INCOME
99.9/ 100
METRIC RATING
45th/ 347
METRIC RANK
$73,509
MEDIAN HOUSEHOLD INCOME
0.1/ 100
METRIC RATING
294th/ 347
METRIC RANK
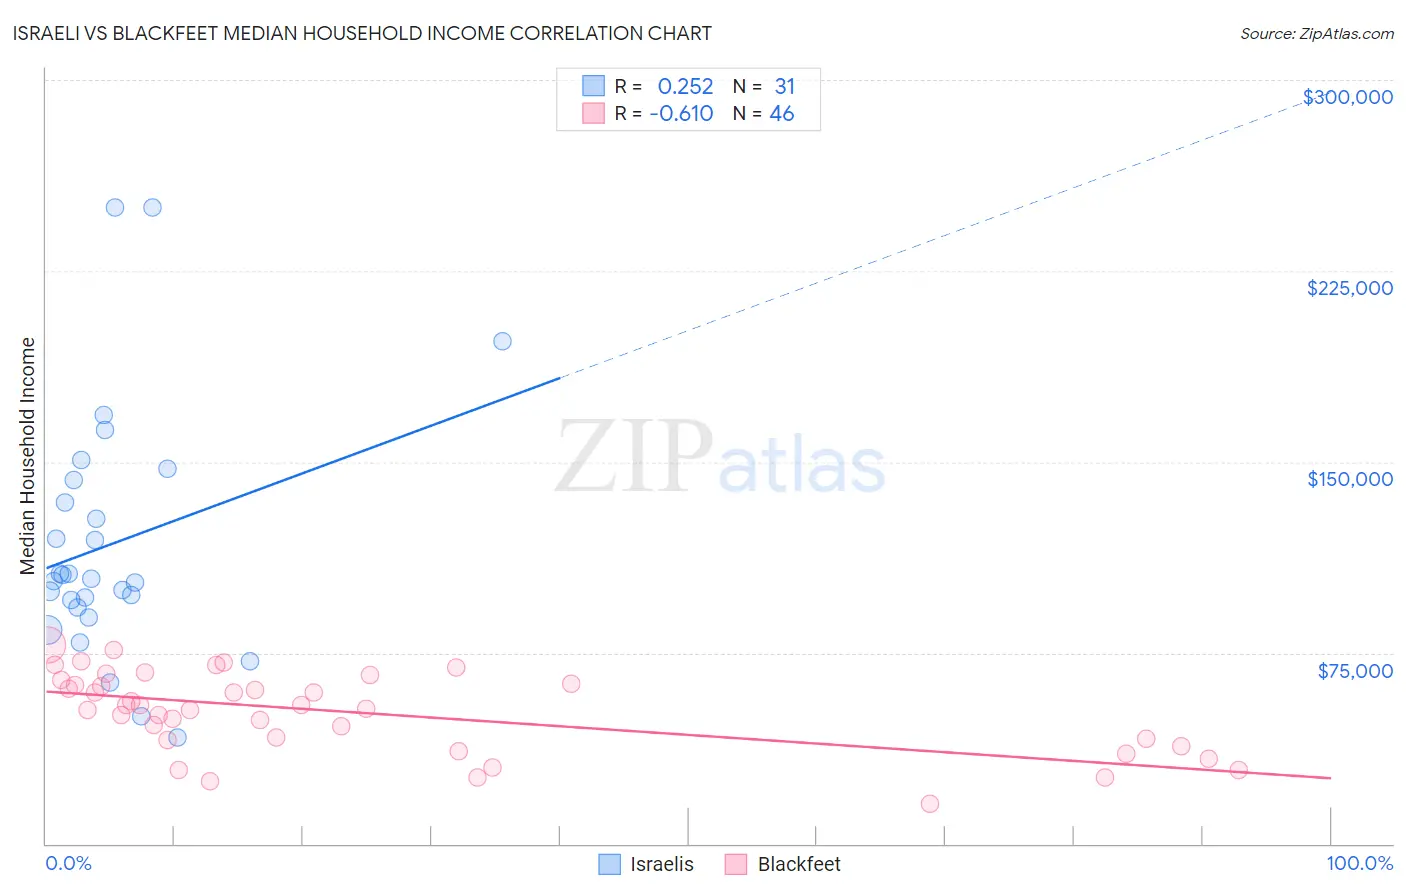
Israeli vs Blackfeet Median Household Income Correlation Chart
The statistical analysis conducted on geographies consisting of 210,971,551 people shows a weak positive correlation between the proportion of Israelis and median household income in the United States with a correlation coefficient (R) of 0.252 and weighted average of $96,552. Similarly, the statistical analysis conducted on geographies consisting of 309,432,508 people shows a significant negative correlation between the proportion of Blackfeet and median household income in the United States with a correlation coefficient (R) of -0.610 and weighted average of $73,509, a difference of 31.4%.
Median Household Income Correlation Summary
| Measurement | Israeli | Blackfeet |
| Minimum | $41,875 | $15,625 |
| Maximum | $250,001 | $77,855 |
| Range | $208,126 | $62,230 |
| Mean | $117,996 | $51,582 |
| Median | $104,190 | $53,641 |
| Interquartile 25% (IQ1) | $92,986 | $40,750 |
| Interquartile 75% (IQ3) | $142,824 | $62,870 |
| Interquartile Range (IQR) | $49,838 | $22,120 |
| Standard Deviation (Sample) | $48,790 | $15,583 |
| Standard Deviation (Population) | $47,997 | $15,413 |
Similar Demographics by Median Household Income
Demographics Similar to Israelis by Median Household Income
In terms of median household income, the demographic groups most similar to Israelis are Australian ($96,490, a difference of 0.060%), Immigrants from Greece ($96,675, a difference of 0.13%), Immigrants from Russia ($96,378, a difference of 0.18%), Immigrants from France ($96,743, a difference of 0.20%), and Cambodian ($96,324, a difference of 0.24%).
| Demographics | Rating | Rank | Median Household Income |
| Immigrants | Indonesia | 100.0 /100 | #38 | Exceptional $97,297 |
| Afghans | 100.0 /100 | #39 | Exceptional $97,026 |
| Maltese | 100.0 /100 | #40 | Exceptional $97,015 |
| Immigrants | Turkey | 100.0 /100 | #41 | Exceptional $96,964 |
| Immigrants | Lithuania | 99.9 /100 | #42 | Exceptional $96,836 |
| Immigrants | France | 99.9 /100 | #43 | Exceptional $96,743 |
| Immigrants | Greece | 99.9 /100 | #44 | Exceptional $96,675 |
| Israelis | 99.9 /100 | #45 | Exceptional $96,552 |
| Australians | 99.9 /100 | #46 | Exceptional $96,490 |
| Immigrants | Russia | 99.9 /100 | #47 | Exceptional $96,378 |
| Cambodians | 99.9 /100 | #48 | Exceptional $96,324 |
| Immigrants | Malaysia | 99.9 /100 | #49 | Exceptional $96,292 |
| Bulgarians | 99.9 /100 | #50 | Exceptional $96,290 |
| Estonians | 99.9 /100 | #51 | Exceptional $95,930 |
| Immigrants | South Africa | 99.9 /100 | #52 | Exceptional $95,800 |
Demographics Similar to Blackfeet by Median Household Income
In terms of median household income, the demographic groups most similar to Blackfeet are Immigrants from Cabo Verde ($73,515, a difference of 0.010%), Cuban ($73,392, a difference of 0.16%), Haitian ($73,306, a difference of 0.28%), Comanche ($73,747, a difference of 0.32%), and Hispanic or Latino ($73,823, a difference of 0.43%).
| Demographics | Rating | Rank | Median Household Income |
| Iroquois | 0.1 /100 | #287 | Tragic $74,279 |
| Immigrants | Central America | 0.1 /100 | #288 | Tragic $74,217 |
| Fijians | 0.1 /100 | #289 | Tragic $74,205 |
| Bangladeshis | 0.1 /100 | #290 | Tragic $74,112 |
| Hispanics or Latinos | 0.1 /100 | #291 | Tragic $73,823 |
| Comanche | 0.1 /100 | #292 | Tragic $73,747 |
| Immigrants | Cabo Verde | 0.1 /100 | #293 | Tragic $73,515 |
| Blackfeet | 0.1 /100 | #294 | Tragic $73,509 |
| Cubans | 0.1 /100 | #295 | Tragic $73,392 |
| Haitians | 0.1 /100 | #296 | Tragic $73,306 |
| Immigrants | Mexico | 0.0 /100 | #297 | Tragic $73,160 |
| Paiute | 0.0 /100 | #298 | Tragic $72,959 |
| Indonesians | 0.0 /100 | #299 | Tragic $72,856 |
| Immigrants | Dominica | 0.0 /100 | #300 | Tragic $72,760 |
| Cherokee | 0.0 /100 | #301 | Tragic $72,682 |