Jordanian vs Austrian Female Disability
COMPARE
Jordanian
Austrian
Female Disability
Female Disability Comparison
Jordanians
Austrians
11.3%
FEMALE DISABILITY
100.0/ 100
METRIC RATING
47th/ 347
METRIC RANK
12.3%
FEMALE DISABILITY
33.3/ 100
METRIC RATING
186th/ 347
METRIC RANK
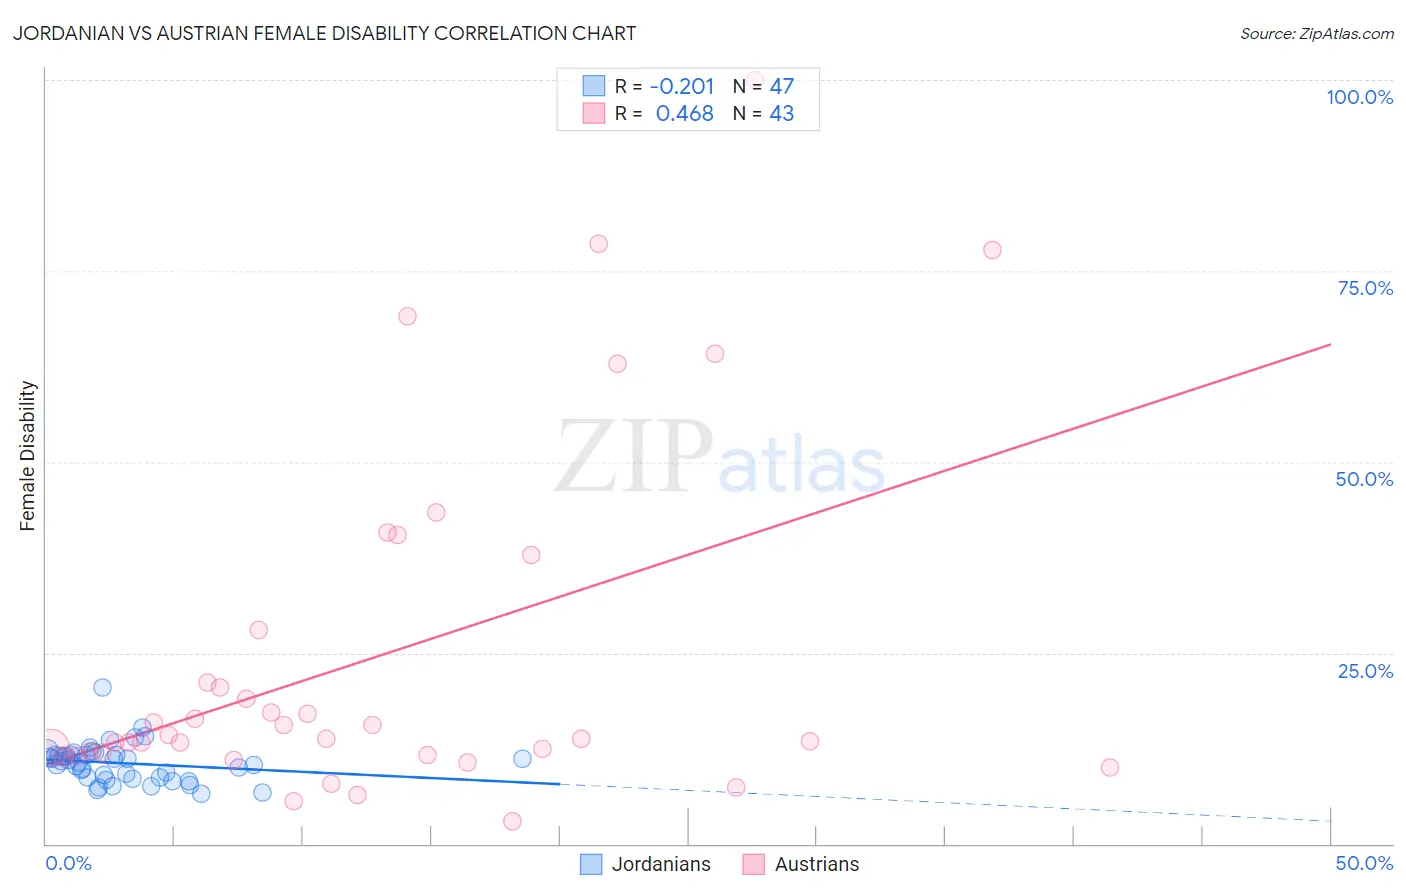
Jordanian vs Austrian Female Disability Correlation Chart
The statistical analysis conducted on geographies consisting of 166,415,888 people shows a weak negative correlation between the proportion of Jordanians and percentage of females with a disability in the United States with a correlation coefficient (R) of -0.201 and weighted average of 11.3%. Similarly, the statistical analysis conducted on geographies consisting of 452,021,932 people shows a moderate positive correlation between the proportion of Austrians and percentage of females with a disability in the United States with a correlation coefficient (R) of 0.468 and weighted average of 12.3%, a difference of 8.9%.
Female Disability Correlation Summary
| Measurement | Jordanian | Austrian |
| Minimum | 6.5% | 2.9% |
| Maximum | 20.5% | 100.0% |
| Range | 14.0% | 97.1% |
| Mean | 10.6% | 24.5% |
| Median | 10.9% | 13.7% |
| Interquartile 25% (IQ1) | 8.6% | 11.6% |
| Interquartile 75% (IQ3) | 11.6% | 28.0% |
| Interquartile Range (IQR) | 3.0% | 16.3% |
| Standard Deviation (Sample) | 2.5% | 23.1% |
| Standard Deviation (Population) | 2.5% | 22.8% |
Similar Demographics by Female Disability
Demographics Similar to Jordanians by Female Disability
In terms of female disability, the demographic groups most similar to Jordanians are Zimbabwean (11.3%, a difference of 0.0%), Tongan (11.3%, a difference of 0.010%), Immigrants from Nepal (11.3%, a difference of 0.020%), Immigrants from Sweden (11.3%, a difference of 0.060%), and Cambodian (11.3%, a difference of 0.10%).
| Demographics | Rating | Rank | Female Disability |
| Mongolians | 100.0 /100 | #40 | Exceptional 11.2% |
| Paraguayans | 100.0 /100 | #41 | Exceptional 11.2% |
| Israelis | 100.0 /100 | #42 | Exceptional 11.2% |
| Afghans | 100.0 /100 | #43 | Exceptional 11.2% |
| Cambodians | 100.0 /100 | #44 | Exceptional 11.3% |
| Immigrants | Sweden | 100.0 /100 | #45 | Exceptional 11.3% |
| Immigrants | Nepal | 100.0 /100 | #46 | Exceptional 11.3% |
| Jordanians | 100.0 /100 | #47 | Exceptional 11.3% |
| Zimbabweans | 100.0 /100 | #48 | Exceptional 11.3% |
| Tongans | 100.0 /100 | #49 | Exceptional 11.3% |
| Inupiat | 100.0 /100 | #50 | Exceptional 11.3% |
| Immigrants | Belgium | 100.0 /100 | #51 | Exceptional 11.3% |
| Immigrants | Peru | 99.9 /100 | #52 | Exceptional 11.3% |
| Immigrants | Saudi Arabia | 99.9 /100 | #53 | Exceptional 11.3% |
| Peruvians | 99.9 /100 | #54 | Exceptional 11.3% |
Demographics Similar to Austrians by Female Disability
In terms of female disability, the demographic groups most similar to Austrians are Serbian (12.3%, a difference of 0.010%), Immigrants from Uzbekistan (12.3%, a difference of 0.020%), Immigrants from North America (12.3%, a difference of 0.020%), Immigrants from Albania (12.3%, a difference of 0.080%), and Immigrants from Honduras (12.3%, a difference of 0.090%).
| Demographics | Rating | Rank | Female Disability |
| Immigrants | Fiji | 38.2 /100 | #179 | Fair 12.3% |
| Albanians | 37.9 /100 | #180 | Fair 12.3% |
| Immigrants | Canada | 37.2 /100 | #181 | Fair 12.3% |
| Norwegians | 36.9 /100 | #182 | Fair 12.3% |
| Cubans | 36.5 /100 | #183 | Fair 12.3% |
| Iraqis | 36.0 /100 | #184 | Fair 12.3% |
| Immigrants | Uzbekistan | 33.9 /100 | #185 | Fair 12.3% |
| Austrians | 33.3 /100 | #186 | Fair 12.3% |
| Serbians | 33.1 /100 | #187 | Fair 12.3% |
| Immigrants | North America | 32.8 /100 | #188 | Fair 12.3% |
| Immigrants | Albania | 31.6 /100 | #189 | Fair 12.3% |
| Immigrants | Honduras | 31.3 /100 | #190 | Fair 12.3% |
| Armenians | 29.7 /100 | #191 | Fair 12.3% |
| Immigrants | Western Africa | 29.2 /100 | #192 | Fair 12.3% |
| Northern Europeans | 27.5 /100 | #193 | Fair 12.3% |