Jordanian vs Nicaraguan Median Male Earnings
COMPARE
Jordanian
Nicaraguan
Median Male Earnings
Median Male Earnings Comparison
Jordanians
Nicaraguans
$58,500
MEDIAN MALE EARNINGS
98.1/ 100
METRIC RATING
98th/ 347
METRIC RANK
$49,215
MEDIAN MALE EARNINGS
0.6/ 100
METRIC RATING
263rd/ 347
METRIC RANK
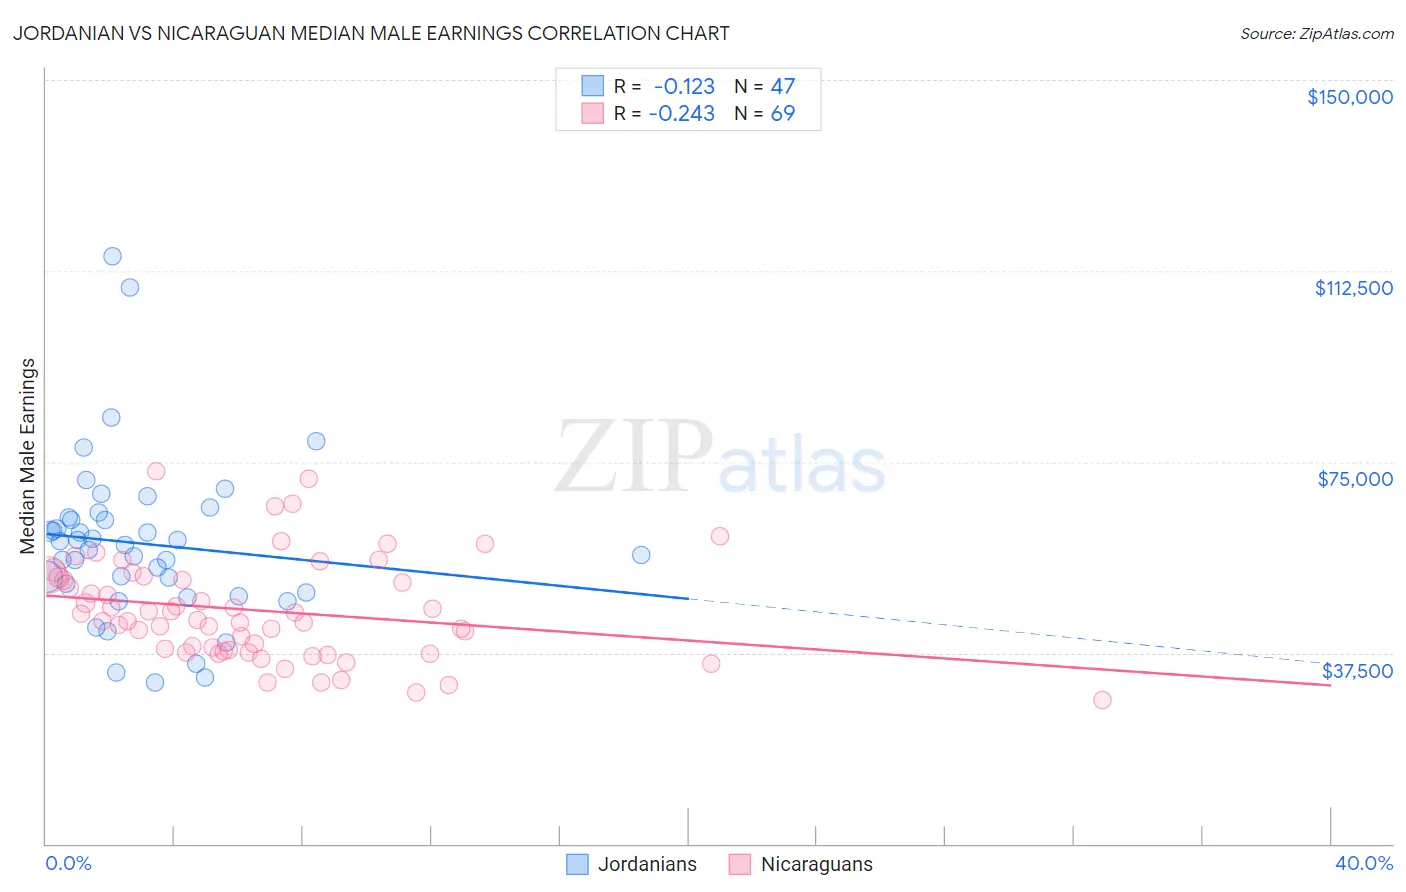
Jordanian vs Nicaraguan Median Male Earnings Correlation Chart
The statistical analysis conducted on geographies consisting of 166,398,060 people shows a poor negative correlation between the proportion of Jordanians and median male earnings in the United States with a correlation coefficient (R) of -0.123 and weighted average of $58,500. Similarly, the statistical analysis conducted on geographies consisting of 285,681,688 people shows a weak negative correlation between the proportion of Nicaraguans and median male earnings in the United States with a correlation coefficient (R) of -0.243 and weighted average of $49,215, a difference of 18.9%.
Median Male Earnings Correlation Summary
| Measurement | Jordanian | Nicaraguan |
| Minimum | $31,660 | $28,353 |
| Maximum | $115,416 | $73,045 |
| Range | $83,756 | $44,692 |
| Mean | $58,929 | $45,837 |
| Median | $58,675 | $43,824 |
| Interquartile 25% (IQ1) | $49,250 | $37,970 |
| Interquartile 75% (IQ3) | $63,996 | $52,426 |
| Interquartile Range (IQR) | $14,746 | $14,456 |
| Standard Deviation (Sample) | $16,248 | $9,879 |
| Standard Deviation (Population) | $16,074 | $9,808 |
Similar Demographics by Median Male Earnings
Demographics Similar to Jordanians by Median Male Earnings
In terms of median male earnings, the demographic groups most similar to Jordanians are Immigrants from Poland ($58,452, a difference of 0.080%), Assyrian/Chaldean/Syriac ($58,437, a difference of 0.11%), Northern European ($58,588, a difference of 0.15%), Immigrants from Brazil ($58,324, a difference of 0.30%), and Albanian ($58,680, a difference of 0.31%).
| Demographics | Rating | Rank | Median Male Earnings |
| Laotians | 99.2 /100 | #91 | Exceptional $59,351 |
| Immigrants | Kazakhstan | 99.1 /100 | #92 | Exceptional $59,278 |
| Immigrants | Southern Europe | 99.0 /100 | #93 | Exceptional $59,217 |
| Immigrants | North Macedonia | 99.0 /100 | #94 | Exceptional $59,189 |
| Immigrants | Lebanon | 98.6 /100 | #95 | Exceptional $58,835 |
| Albanians | 98.4 /100 | #96 | Exceptional $58,680 |
| Northern Europeans | 98.2 /100 | #97 | Exceptional $58,588 |
| Jordanians | 98.1 /100 | #98 | Exceptional $58,500 |
| Immigrants | Poland | 98.0 /100 | #99 | Exceptional $58,452 |
| Assyrians/Chaldeans/Syriacs | 97.9 /100 | #100 | Exceptional $58,437 |
| Immigrants | Brazil | 97.7 /100 | #101 | Exceptional $58,324 |
| Syrians | 97.4 /100 | #102 | Exceptional $58,187 |
| Poles | 97.3 /100 | #103 | Exceptional $58,139 |
| Armenians | 97.3 /100 | #104 | Exceptional $58,134 |
| Immigrants | Western Asia | 97.3 /100 | #105 | Exceptional $58,131 |
Demographics Similar to Nicaraguans by Median Male Earnings
In terms of median male earnings, the demographic groups most similar to Nicaraguans are Immigrants from Middle Africa ($49,201, a difference of 0.030%), Immigrants from Laos ($49,190, a difference of 0.050%), Immigrants from West Indies ($49,271, a difference of 0.11%), Liberian ($49,318, a difference of 0.21%), and Iroquois ($49,374, a difference of 0.32%).
| Demographics | Rating | Rank | Median Male Earnings |
| Alaska Natives | 0.9 /100 | #256 | Tragic $49,711 |
| British West Indians | 0.8 /100 | #257 | Tragic $49,636 |
| Cree | 0.7 /100 | #258 | Tragic $49,497 |
| Nepalese | 0.7 /100 | #259 | Tragic $49,458 |
| Iroquois | 0.7 /100 | #260 | Tragic $49,374 |
| Liberians | 0.6 /100 | #261 | Tragic $49,318 |
| Immigrants | West Indies | 0.6 /100 | #262 | Tragic $49,271 |
| Nicaraguans | 0.6 /100 | #263 | Tragic $49,215 |
| Immigrants | Middle Africa | 0.6 /100 | #264 | Tragic $49,201 |
| Immigrants | Laos | 0.6 /100 | #265 | Tragic $49,190 |
| Somalis | 0.5 /100 | #266 | Tragic $49,025 |
| Spanish Americans | 0.5 /100 | #267 | Tragic $49,008 |
| Ute | 0.4 /100 | #268 | Tragic $48,899 |
| Tsimshian | 0.4 /100 | #269 | Tragic $48,836 |
| Potawatomi | 0.4 /100 | #270 | Tragic $48,768 |