Immigrants from Panama vs Immigrants from Barbados Median Household Income
COMPARE
Immigrants from Panama
Immigrants from Barbados
Median Household Income
Median Household Income Comparison
Immigrants from Panama
Immigrants from Barbados
$80,873
MEDIAN HOUSEHOLD INCOME
6.2/ 100
METRIC RATING
226th/ 347
METRIC RANK
$78,989
MEDIAN HOUSEHOLD INCOME
1.9/ 100
METRIC RATING
243rd/ 347
METRIC RANK
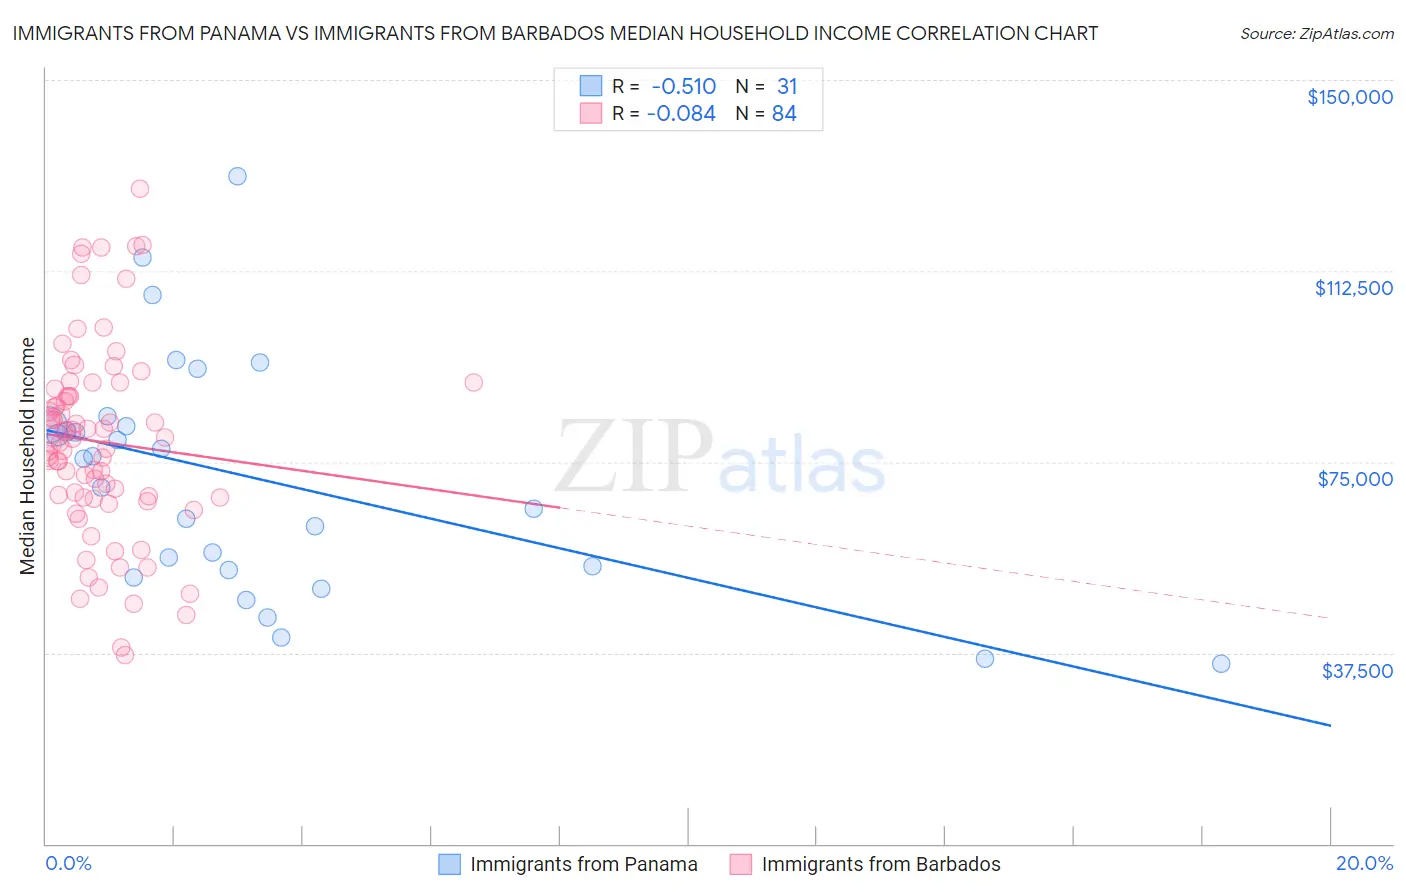
Immigrants from Panama vs Immigrants from Barbados Median Household Income Correlation Chart
The statistical analysis conducted on geographies consisting of 221,141,293 people shows a substantial negative correlation between the proportion of Immigrants from Panama and median household income in the United States with a correlation coefficient (R) of -0.510 and weighted average of $80,873. Similarly, the statistical analysis conducted on geographies consisting of 112,738,981 people shows a slight negative correlation between the proportion of Immigrants from Barbados and median household income in the United States with a correlation coefficient (R) of -0.084 and weighted average of $78,989, a difference of 2.4%.
Median Household Income Correlation Summary
| Measurement | Immigrants from Panama | Immigrants from Barbados |
| Minimum | $35,430 | $37,105 |
| Maximum | $130,979 | $128,750 |
| Range | $95,549 | $91,645 |
| Mean | $71,805 | $78,963 |
| Median | $75,655 | $79,093 |
| Interquartile 25% (IQ1) | $53,712 | $67,974 |
| Interquartile 75% (IQ3) | $82,267 | $88,607 |
| Interquartile Range (IQR) | $28,555 | $20,633 |
| Standard Deviation (Sample) | $23,036 | $18,879 |
| Standard Deviation (Population) | $22,661 | $18,767 |
Demographics Similar to Immigrants from Panama and Immigrants from Barbados by Median Household Income
In terms of median household income, the demographic groups most similar to Immigrants from Panama are Scotch-Irish ($80,972, a difference of 0.12%), Guyanese ($80,734, a difference of 0.17%), Immigrants from Bangladesh ($80,722, a difference of 0.19%), Malaysian ($81,064, a difference of 0.24%), and Delaware ($80,527, a difference of 0.43%). Similarly, the demographic groups most similar to Immigrants from Barbados are Marshallese ($78,930, a difference of 0.080%), Immigrants from Sudan ($79,103, a difference of 0.14%), Nonimmigrants ($79,429, a difference of 0.56%), Immigrants from Western Africa ($79,490, a difference of 0.63%), and Alaska Native ($79,509, a difference of 0.66%).
| Demographics | Rating | Rank | Median Household Income |
| Malaysians | 7.0 /100 | #224 | Tragic $81,064 |
| Scotch-Irish | 6.6 /100 | #225 | Tragic $80,972 |
| Immigrants | Panama | 6.2 /100 | #226 | Tragic $80,873 |
| Guyanese | 5.7 /100 | #227 | Tragic $80,734 |
| Immigrants | Bangladesh | 5.7 /100 | #228 | Tragic $80,722 |
| Delaware | 5.0 /100 | #229 | Tragic $80,527 |
| Bermudans | 4.7 /100 | #230 | Tragic $80,406 |
| Trinidadians and Tobagonians | 4.7 /100 | #231 | Tragic $80,402 |
| Immigrants | Trinidad and Tobago | 4.6 /100 | #232 | Tragic $80,373 |
| Immigrants | Azores | 4.5 /100 | #233 | Tragic $80,357 |
| Immigrants | Ecuador | 4.5 /100 | #234 | Tragic $80,341 |
| Immigrants | Guyana | 4.5 /100 | #235 | Tragic $80,324 |
| Immigrants | Bosnia and Herzegovina | 3.4 /100 | #236 | Tragic $79,888 |
| Nicaraguans | 3.1 /100 | #237 | Tragic $79,737 |
| Barbadians | 3.0 /100 | #238 | Tragic $79,664 |
| Alaska Natives | 2.7 /100 | #239 | Tragic $79,509 |
| Immigrants | Western Africa | 2.7 /100 | #240 | Tragic $79,490 |
| Immigrants | Nonimmigrants | 2.6 /100 | #241 | Tragic $79,429 |
| Immigrants | Sudan | 2.1 /100 | #242 | Tragic $79,103 |
| Immigrants | Barbados | 1.9 /100 | #243 | Tragic $78,989 |
| Marshallese | 1.9 /100 | #244 | Tragic $78,930 |