Jamaican vs German Russian Householder Income Ages 25 - 44 years
COMPARE
Jamaican
German Russian
Householder Income Ages 25 - 44 years
Householder Income Ages 25 - 44 years Comparison
Jamaicans
German Russians
$83,933
HOUSEHOLDER INCOME AGES 25 - 44 YEARS
0.3/ 100
METRIC RATING
270th/ 347
METRIC RANK
$85,220
HOUSEHOLDER INCOME AGES 25 - 44 YEARS
0.6/ 100
METRIC RATING
255th/ 347
METRIC RANK
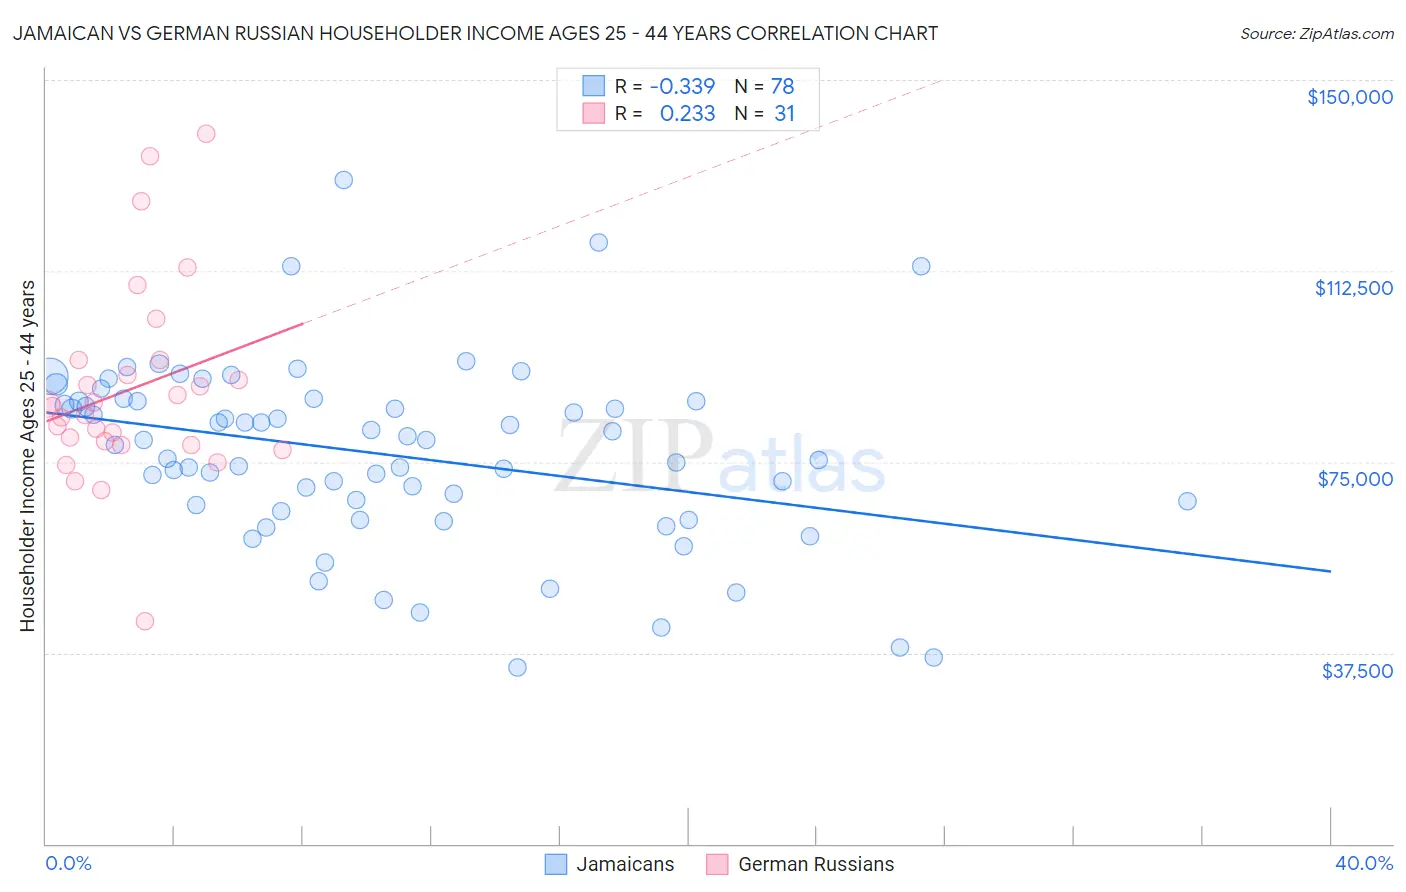
Jamaican vs German Russian Householder Income Ages 25 - 44 years Correlation Chart
The statistical analysis conducted on geographies consisting of 367,030,612 people shows a mild negative correlation between the proportion of Jamaicans and household income with householder between the ages 25 and 44 in the United States with a correlation coefficient (R) of -0.339 and weighted average of $83,933. Similarly, the statistical analysis conducted on geographies consisting of 96,370,550 people shows a weak positive correlation between the proportion of German Russians and household income with householder between the ages 25 and 44 in the United States with a correlation coefficient (R) of 0.233 and weighted average of $85,220, a difference of 1.5%.
Householder Income Ages 25 - 44 years Correlation Summary
| Measurement | Jamaican | German Russian |
| Minimum | $34,529 | $43,750 |
| Maximum | $130,290 | $139,479 |
| Range | $95,761 | $95,729 |
| Mean | $76,521 | $89,217 |
| Median | $78,807 | $85,878 |
| Interquartile 25% (IQ1) | $66,599 | $78,393 |
| Interquartile 75% (IQ3) | $86,908 | $94,895 |
| Interquartile Range (IQR) | $20,309 | $16,502 |
| Standard Deviation (Sample) | $17,827 | $19,398 |
| Standard Deviation (Population) | $17,712 | $19,082 |
Demographics Similar to Jamaicans and German Russians by Householder Income Ages 25 - 44 years
In terms of householder income ages 25 - 44 years, the demographic groups most similar to Jamaicans are Spanish American Indian ($84,085, a difference of 0.18%), Somali ($83,752, a difference of 0.22%), Spanish American ($83,722, a difference of 0.25%), Subsaharan African ($84,235, a difference of 0.36%), and Hmong ($84,258, a difference of 0.39%). Similarly, the demographic groups most similar to German Russians are Central American ($85,144, a difference of 0.090%), Mexican American Indian ($85,066, a difference of 0.18%), Immigrants from Nicaragua ($84,914, a difference of 0.36%), Immigrants from Laos ($85,553, a difference of 0.39%), and British West Indian ($85,565, a difference of 0.40%).
| Demographics | Rating | Rank | Householder Income Ages 25 - 44 years |
| Immigrants | Western Africa | 0.7 /100 | #252 | Tragic $85,676 |
| British West Indians | 0.7 /100 | #253 | Tragic $85,565 |
| Immigrants | Laos | 0.7 /100 | #254 | Tragic $85,553 |
| German Russians | 0.6 /100 | #255 | Tragic $85,220 |
| Central Americans | 0.5 /100 | #256 | Tragic $85,144 |
| Mexican American Indians | 0.5 /100 | #257 | Tragic $85,066 |
| Immigrants | Nicaragua | 0.5 /100 | #258 | Tragic $84,914 |
| Immigrants | Senegal | 0.5 /100 | #259 | Tragic $84,848 |
| Americans | 0.4 /100 | #260 | Tragic $84,791 |
| Inupiat | 0.4 /100 | #261 | Tragic $84,619 |
| Cree | 0.4 /100 | #262 | Tragic $84,574 |
| Belizeans | 0.4 /100 | #263 | Tragic $84,534 |
| Osage | 0.4 /100 | #264 | Tragic $84,461 |
| Sudanese | 0.4 /100 | #265 | Tragic $84,401 |
| Immigrants | Cabo Verde | 0.3 /100 | #266 | Tragic $84,304 |
| Hmong | 0.3 /100 | #267 | Tragic $84,258 |
| Sub-Saharan Africans | 0.3 /100 | #268 | Tragic $84,235 |
| Spanish American Indians | 0.3 /100 | #269 | Tragic $84,085 |
| Jamaicans | 0.3 /100 | #270 | Tragic $83,933 |
| Somalis | 0.2 /100 | #271 | Tragic $83,752 |
| Spanish Americans | 0.2 /100 | #272 | Tragic $83,722 |