Mexican American Indian vs Northern European Median Earnings
COMPARE
Mexican American Indian
Northern European
Median Earnings
Median Earnings Comparison
Mexican American Indians
Northern Europeans
$41,719
MEDIAN EARNINGS
0.1/ 100
METRIC RATING
286th/ 347
METRIC RANK
$48,887
MEDIAN EARNINGS
96.9/ 100
METRIC RATING
112th/ 347
METRIC RANK
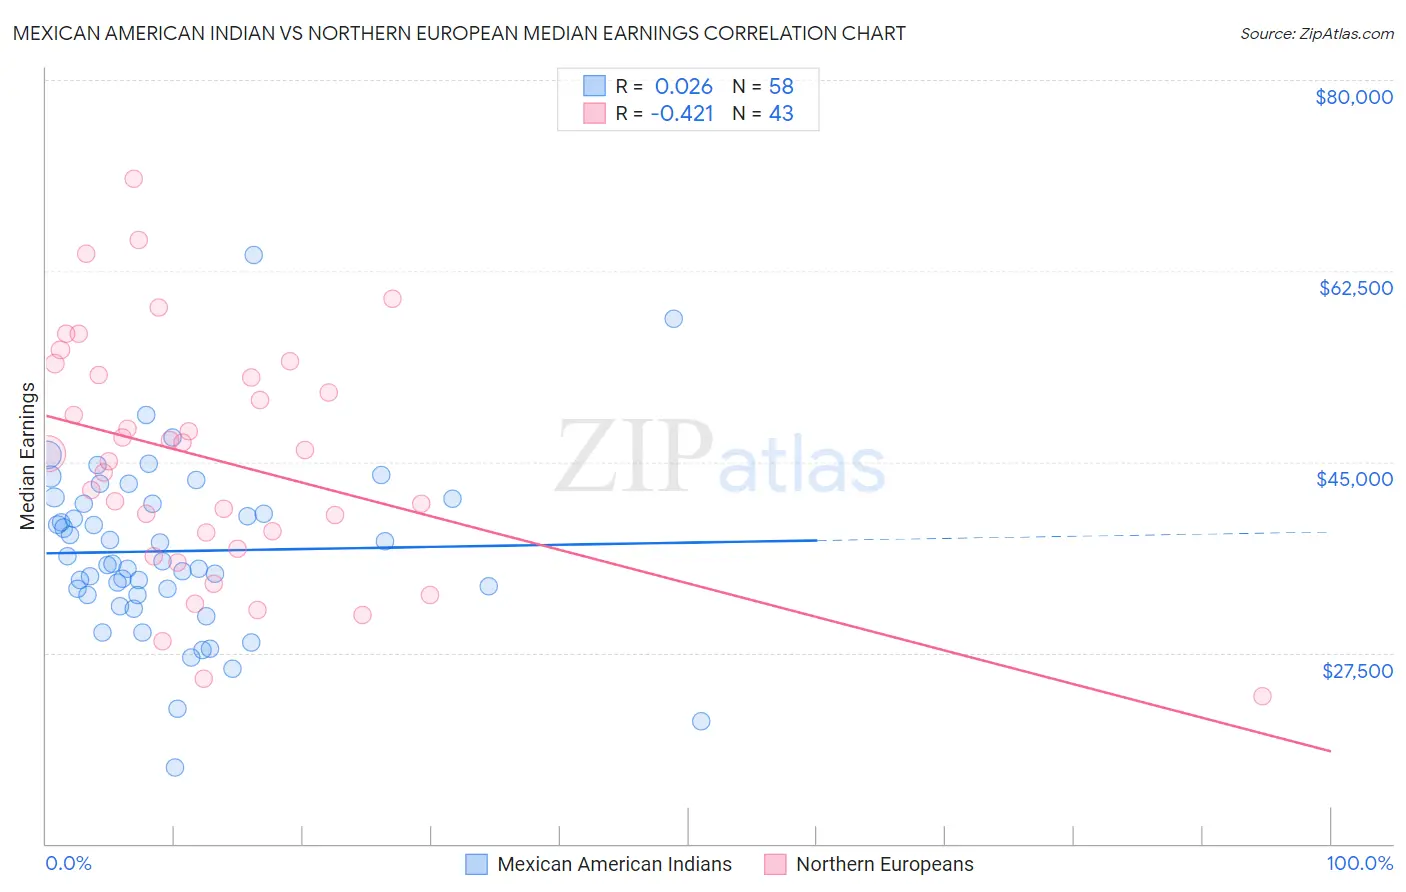
Mexican American Indian vs Northern European Median Earnings Correlation Chart
The statistical analysis conducted on geographies consisting of 317,581,604 people shows no correlation between the proportion of Mexican American Indians and median earnings in the United States with a correlation coefficient (R) of 0.026 and weighted average of $41,719. Similarly, the statistical analysis conducted on geographies consisting of 406,030,818 people shows a moderate negative correlation between the proportion of Northern Europeans and median earnings in the United States with a correlation coefficient (R) of -0.421 and weighted average of $48,887, a difference of 17.2%.
Median Earnings Correlation Summary
| Measurement | Mexican American Indian | Northern European |
| Minimum | $16,986 | $23,571 |
| Maximum | $63,917 | $70,939 |
| Range | $46,931 | $47,368 |
| Mean | $36,825 | $45,160 |
| Median | $35,754 | $45,714 |
| Interquartile 25% (IQ1) | $32,817 | $37,035 |
| Interquartile 75% (IQ3) | $41,197 | $52,998 |
| Interquartile Range (IQR) | $8,379 | $15,963 |
| Standard Deviation (Sample) | $7,970 | $10,934 |
| Standard Deviation (Population) | $7,901 | $10,806 |
Similar Demographics by Median Earnings
Demographics Similar to Mexican American Indians by Median Earnings
In terms of median earnings, the demographic groups most similar to Mexican American Indians are Immigrants from Nicaragua ($41,737, a difference of 0.040%), Indonesian ($41,701, a difference of 0.040%), Blackfeet ($41,822, a difference of 0.25%), Dominican ($41,864, a difference of 0.35%), and Immigrants from Dominican Republic ($41,554, a difference of 0.40%).
| Demographics | Rating | Rank | Median Earnings |
| Colville | 0.2 /100 | #279 | Tragic $42,151 |
| Hmong | 0.2 /100 | #280 | Tragic $42,111 |
| Marshallese | 0.2 /100 | #281 | Tragic $41,969 |
| Africans | 0.2 /100 | #282 | Tragic $41,955 |
| Dominicans | 0.2 /100 | #283 | Tragic $41,864 |
| Blackfeet | 0.2 /100 | #284 | Tragic $41,822 |
| Immigrants | Nicaragua | 0.1 /100 | #285 | Tragic $41,737 |
| Mexican American Indians | 0.1 /100 | #286 | Tragic $41,719 |
| Indonesians | 0.1 /100 | #287 | Tragic $41,701 |
| Immigrants | Dominican Republic | 0.1 /100 | #288 | Tragic $41,554 |
| Comanche | 0.1 /100 | #289 | Tragic $41,519 |
| Paiute | 0.1 /100 | #290 | Tragic $41,508 |
| Central American Indians | 0.1 /100 | #291 | Tragic $41,474 |
| U.S. Virgin Islanders | 0.1 /100 | #292 | Tragic $41,448 |
| Immigrants | Zaire | 0.1 /100 | #293 | Tragic $41,325 |
Demographics Similar to Northern Europeans by Median Earnings
In terms of median earnings, the demographic groups most similar to Northern Europeans are Immigrants from Zimbabwe ($48,913, a difference of 0.050%), Immigrants from Kuwait ($48,861, a difference of 0.050%), Immigrants from Ethiopia ($48,924, a difference of 0.070%), Syrian ($48,934, a difference of 0.10%), and Moroccan ($48,838, a difference of 0.10%).
| Demographics | Rating | Rank | Median Earnings |
| Immigrants | Western Asia | 98.4 /100 | #105 | Exceptional $49,389 |
| Immigrants | Albania | 98.4 /100 | #106 | Exceptional $49,377 |
| Immigrants | Morocco | 98.4 /100 | #107 | Exceptional $49,368 |
| Palestinians | 98.0 /100 | #108 | Exceptional $49,209 |
| Syrians | 97.1 /100 | #109 | Exceptional $48,934 |
| Immigrants | Ethiopia | 97.1 /100 | #110 | Exceptional $48,924 |
| Immigrants | Zimbabwe | 97.0 /100 | #111 | Exceptional $48,913 |
| Northern Europeans | 96.9 /100 | #112 | Exceptional $48,887 |
| Immigrants | Kuwait | 96.8 /100 | #113 | Exceptional $48,861 |
| Moroccans | 96.7 /100 | #114 | Exceptional $48,838 |
| Chinese | 96.7 /100 | #115 | Exceptional $48,836 |
| Koreans | 96.2 /100 | #116 | Exceptional $48,727 |
| Serbians | 95.9 /100 | #117 | Exceptional $48,677 |
| Immigrants | Jordan | 95.9 /100 | #118 | Exceptional $48,673 |
| Poles | 95.8 /100 | #119 | Exceptional $48,659 |