Israeli vs Pueblo Median Household Income
COMPARE
Israeli
Pueblo
Median Household Income
Median Household Income Comparison
Israelis
Pueblo
$96,552
MEDIAN HOUSEHOLD INCOME
99.9/ 100
METRIC RATING
45th/ 347
METRIC RANK
$64,692
MEDIAN HOUSEHOLD INCOME
0.0/ 100
METRIC RATING
340th/ 347
METRIC RANK
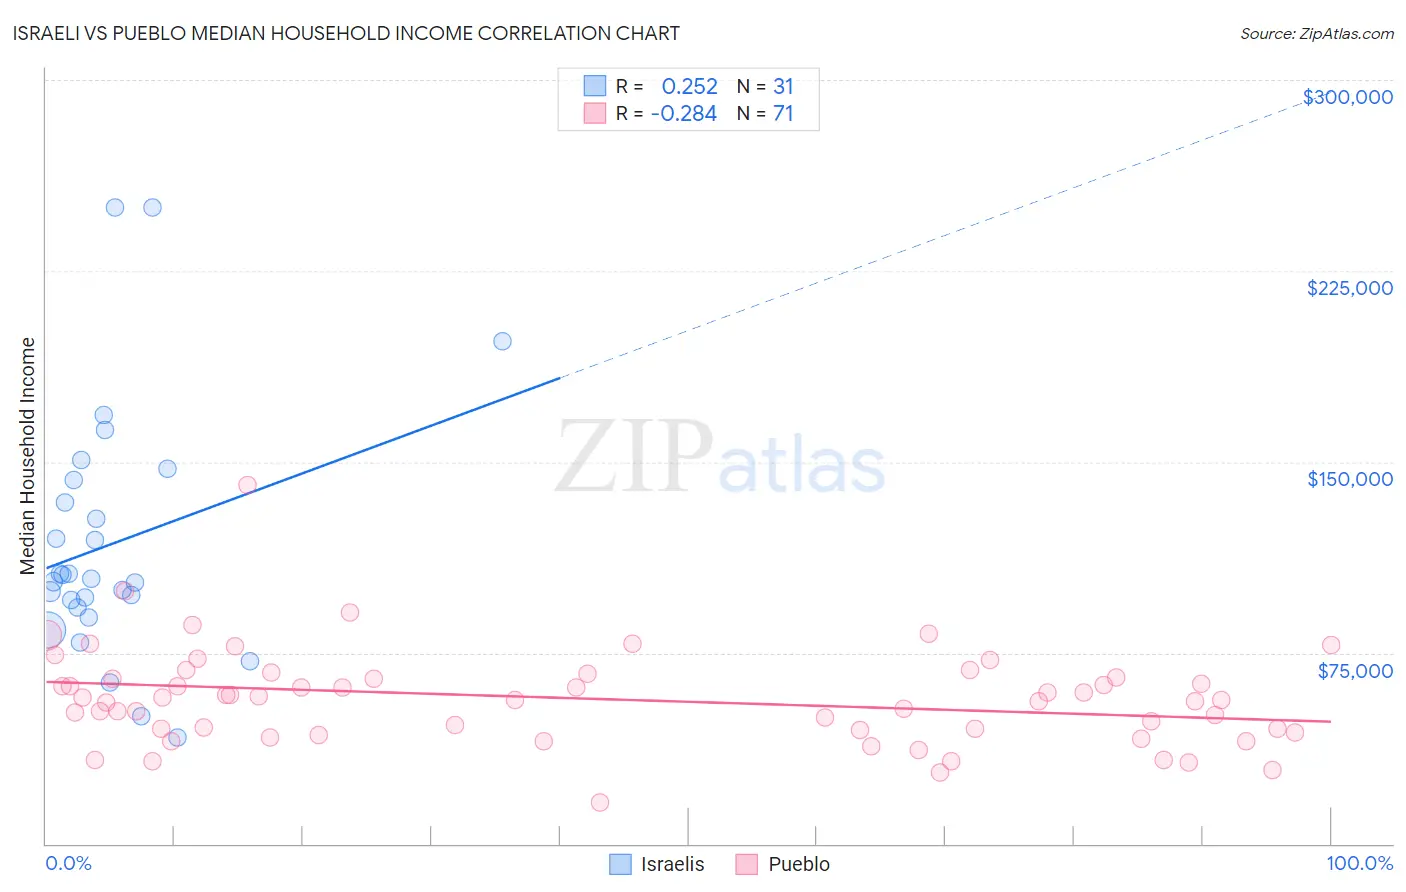
Israeli vs Pueblo Median Household Income Correlation Chart
The statistical analysis conducted on geographies consisting of 210,971,551 people shows a weak positive correlation between the proportion of Israelis and median household income in the United States with a correlation coefficient (R) of 0.252 and weighted average of $96,552. Similarly, the statistical analysis conducted on geographies consisting of 120,058,820 people shows a weak negative correlation between the proportion of Pueblo and median household income in the United States with a correlation coefficient (R) of -0.284 and weighted average of $64,692, a difference of 49.2%.
Median Household Income Correlation Summary
| Measurement | Israeli | Pueblo |
| Minimum | $41,875 | $16,250 |
| Maximum | $250,001 | $141,139 |
| Range | $208,126 | $124,889 |
| Mean | $117,996 | $56,992 |
| Median | $104,190 | $56,397 |
| Interquartile 25% (IQ1) | $92,986 | $44,868 |
| Interquartile 75% (IQ3) | $142,824 | $65,216 |
| Interquartile Range (IQR) | $49,838 | $20,348 |
| Standard Deviation (Sample) | $48,790 | $19,041 |
| Standard Deviation (Population) | $47,997 | $18,906 |
Similar Demographics by Median Household Income
Demographics Similar to Israelis by Median Household Income
In terms of median household income, the demographic groups most similar to Israelis are Australian ($96,490, a difference of 0.060%), Immigrants from Greece ($96,675, a difference of 0.13%), Immigrants from Russia ($96,378, a difference of 0.18%), Immigrants from France ($96,743, a difference of 0.20%), and Cambodian ($96,324, a difference of 0.24%).
| Demographics | Rating | Rank | Median Household Income |
| Immigrants | Indonesia | 100.0 /100 | #38 | Exceptional $97,297 |
| Afghans | 100.0 /100 | #39 | Exceptional $97,026 |
| Maltese | 100.0 /100 | #40 | Exceptional $97,015 |
| Immigrants | Turkey | 100.0 /100 | #41 | Exceptional $96,964 |
| Immigrants | Lithuania | 99.9 /100 | #42 | Exceptional $96,836 |
| Immigrants | France | 99.9 /100 | #43 | Exceptional $96,743 |
| Immigrants | Greece | 99.9 /100 | #44 | Exceptional $96,675 |
| Israelis | 99.9 /100 | #45 | Exceptional $96,552 |
| Australians | 99.9 /100 | #46 | Exceptional $96,490 |
| Immigrants | Russia | 99.9 /100 | #47 | Exceptional $96,378 |
| Cambodians | 99.9 /100 | #48 | Exceptional $96,324 |
| Immigrants | Malaysia | 99.9 /100 | #49 | Exceptional $96,292 |
| Bulgarians | 99.9 /100 | #50 | Exceptional $96,290 |
| Estonians | 99.9 /100 | #51 | Exceptional $95,930 |
| Immigrants | South Africa | 99.9 /100 | #52 | Exceptional $95,800 |
Demographics Similar to Pueblo by Median Household Income
In terms of median household income, the demographic groups most similar to Pueblo are Hopi ($65,043, a difference of 0.54%), Immigrants from Yemen ($65,194, a difference of 0.78%), Crow ($63,681, a difference of 1.6%), Kiowa ($65,914, a difference of 1.9%), and Pima ($63,262, a difference of 2.3%).
| Demographics | Rating | Rank | Median Household Income |
| Creek | 0.0 /100 | #333 | Tragic $67,715 |
| Blacks/African Americans | 0.0 /100 | #334 | Tragic $67,573 |
| Cheyenne | 0.0 /100 | #335 | Tragic $66,974 |
| Immigrants | Congo | 0.0 /100 | #336 | Tragic $66,768 |
| Kiowa | 0.0 /100 | #337 | Tragic $65,914 |
| Immigrants | Yemen | 0.0 /100 | #338 | Tragic $65,194 |
| Hopi | 0.0 /100 | #339 | Tragic $65,043 |
| Pueblo | 0.0 /100 | #340 | Tragic $64,692 |
| Crow | 0.0 /100 | #341 | Tragic $63,681 |
| Pima | 0.0 /100 | #342 | Tragic $63,262 |
| Houma | 0.0 /100 | #343 | Tragic $62,575 |
| Tohono O'odham | 0.0 /100 | #344 | Tragic $61,663 |
| Puerto Ricans | 0.0 /100 | #345 | Tragic $59,197 |
| Navajo | 0.0 /100 | #346 | Tragic $59,159 |
| Lumbee | 0.0 /100 | #347 | Tragic $54,644 |