Jordanian vs Cypriot Median Earnings
COMPARE
Jordanian
Cypriot
Median Earnings
Median Earnings Comparison
Jordanians
Cypriots
$49,632
MEDIAN EARNINGS
98.9/ 100
METRIC RATING
101st/ 347
METRIC RANK
$54,589
MEDIAN EARNINGS
100.0/ 100
METRIC RATING
20th/ 347
METRIC RANK
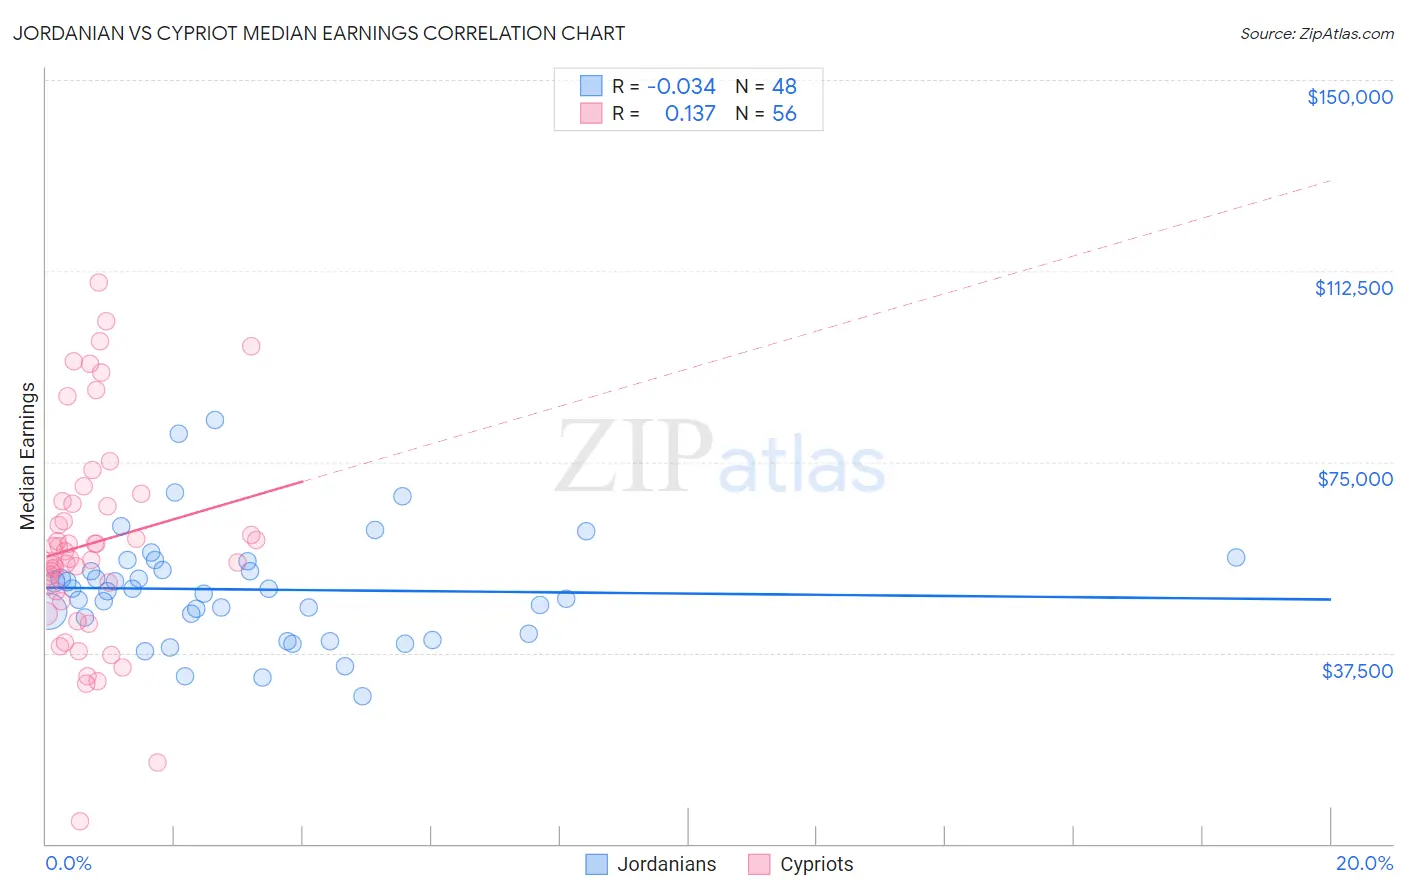
Jordanian vs Cypriot Median Earnings Correlation Chart
The statistical analysis conducted on geographies consisting of 166,400,944 people shows no correlation between the proportion of Jordanians and median earnings in the United States with a correlation coefficient (R) of -0.034 and weighted average of $49,632. Similarly, the statistical analysis conducted on geographies consisting of 61,853,771 people shows a poor positive correlation between the proportion of Cypriots and median earnings in the United States with a correlation coefficient (R) of 0.137 and weighted average of $54,589, a difference of 10.0%.
Median Earnings Correlation Summary
| Measurement | Jordanian | Cypriot |
| Minimum | $29,018 | $4,333 |
| Maximum | $83,283 | $110,295 |
| Range | $54,265 | $105,962 |
| Mean | $49,942 | $59,088 |
| Median | $49,819 | $56,710 |
| Interquartile 25% (IQ1) | $42,798 | $48,668 |
| Interquartile 75% (IQ3) | $54,622 | $66,958 |
| Interquartile Range (IQR) | $11,824 | $18,291 |
| Standard Deviation (Sample) | $11,002 | $21,103 |
| Standard Deviation (Population) | $10,887 | $20,914 |
Similar Demographics by Median Earnings
Demographics Similar to Jordanians by Median Earnings
In terms of median earnings, the demographic groups most similar to Jordanians are Immigrants from Poland ($49,633, a difference of 0.0%), Immigrants from Northern Africa ($49,648, a difference of 0.030%), Immigrants from Afghanistan ($49,645, a difference of 0.030%), Immigrants from North Macedonia ($49,658, a difference of 0.050%), and Immigrants from Lebanon ($49,682, a difference of 0.10%).
| Demographics | Rating | Rank | Median Earnings |
| Croatians | 99.0 /100 | #94 | Exceptional $49,724 |
| Immigrants | England | 99.0 /100 | #95 | Exceptional $49,722 |
| Immigrants | Lebanon | 99.0 /100 | #96 | Exceptional $49,682 |
| Immigrants | North Macedonia | 98.9 /100 | #97 | Exceptional $49,658 |
| Immigrants | Northern Africa | 98.9 /100 | #98 | Exceptional $49,648 |
| Immigrants | Afghanistan | 98.9 /100 | #99 | Exceptional $49,645 |
| Immigrants | Poland | 98.9 /100 | #100 | Exceptional $49,633 |
| Jordanians | 98.9 /100 | #101 | Exceptional $49,632 |
| Ethiopians | 98.8 /100 | #102 | Exceptional $49,572 |
| Austrians | 98.7 /100 | #103 | Exceptional $49,501 |
| Immigrants | Brazil | 98.6 /100 | #104 | Exceptional $49,463 |
| Immigrants | Western Asia | 98.4 /100 | #105 | Exceptional $49,389 |
| Immigrants | Albania | 98.4 /100 | #106 | Exceptional $49,377 |
| Immigrants | Morocco | 98.4 /100 | #107 | Exceptional $49,368 |
| Palestinians | 98.0 /100 | #108 | Exceptional $49,209 |
Demographics Similar to Cypriots by Median Earnings
In terms of median earnings, the demographic groups most similar to Cypriots are Burmese ($54,559, a difference of 0.060%), Immigrants from Korea ($54,530, a difference of 0.11%), Immigrants from Belgium ($54,679, a difference of 0.16%), Immigrants from Sweden ($54,478, a difference of 0.20%), and Soviet Union ($54,290, a difference of 0.55%).
| Demographics | Rating | Rank | Median Earnings |
| Immigrants | China | 100.0 /100 | #13 | Exceptional $56,638 |
| Immigrants | Australia | 100.0 /100 | #14 | Exceptional $56,305 |
| Indians (Asian) | 100.0 /100 | #15 | Exceptional $56,253 |
| Immigrants | Eastern Asia | 100.0 /100 | #16 | Exceptional $56,183 |
| Eastern Europeans | 100.0 /100 | #17 | Exceptional $55,084 |
| Immigrants | Japan | 100.0 /100 | #18 | Exceptional $54,938 |
| Immigrants | Belgium | 100.0 /100 | #19 | Exceptional $54,679 |
| Cypriots | 100.0 /100 | #20 | Exceptional $54,589 |
| Burmese | 100.0 /100 | #21 | Exceptional $54,559 |
| Immigrants | Korea | 100.0 /100 | #22 | Exceptional $54,530 |
| Immigrants | Sweden | 100.0 /100 | #23 | Exceptional $54,478 |
| Soviet Union | 100.0 /100 | #24 | Exceptional $54,290 |
| Turks | 100.0 /100 | #25 | Exceptional $53,919 |
| Immigrants | Northern Europe | 100.0 /100 | #26 | Exceptional $53,872 |
| Asians | 100.0 /100 | #27 | Exceptional $53,690 |