Immigrants from Latin America vs Cypriot Median Earnings
COMPARE
Immigrants from Latin America
Cypriot
Median Earnings
Median Earnings Comparison
Immigrants from Latin America
Cypriots
$41,049
MEDIAN EARNINGS
0.1/ 100
METRIC RATING
301st/ 347
METRIC RANK
$54,589
MEDIAN EARNINGS
100.0/ 100
METRIC RATING
20th/ 347
METRIC RANK
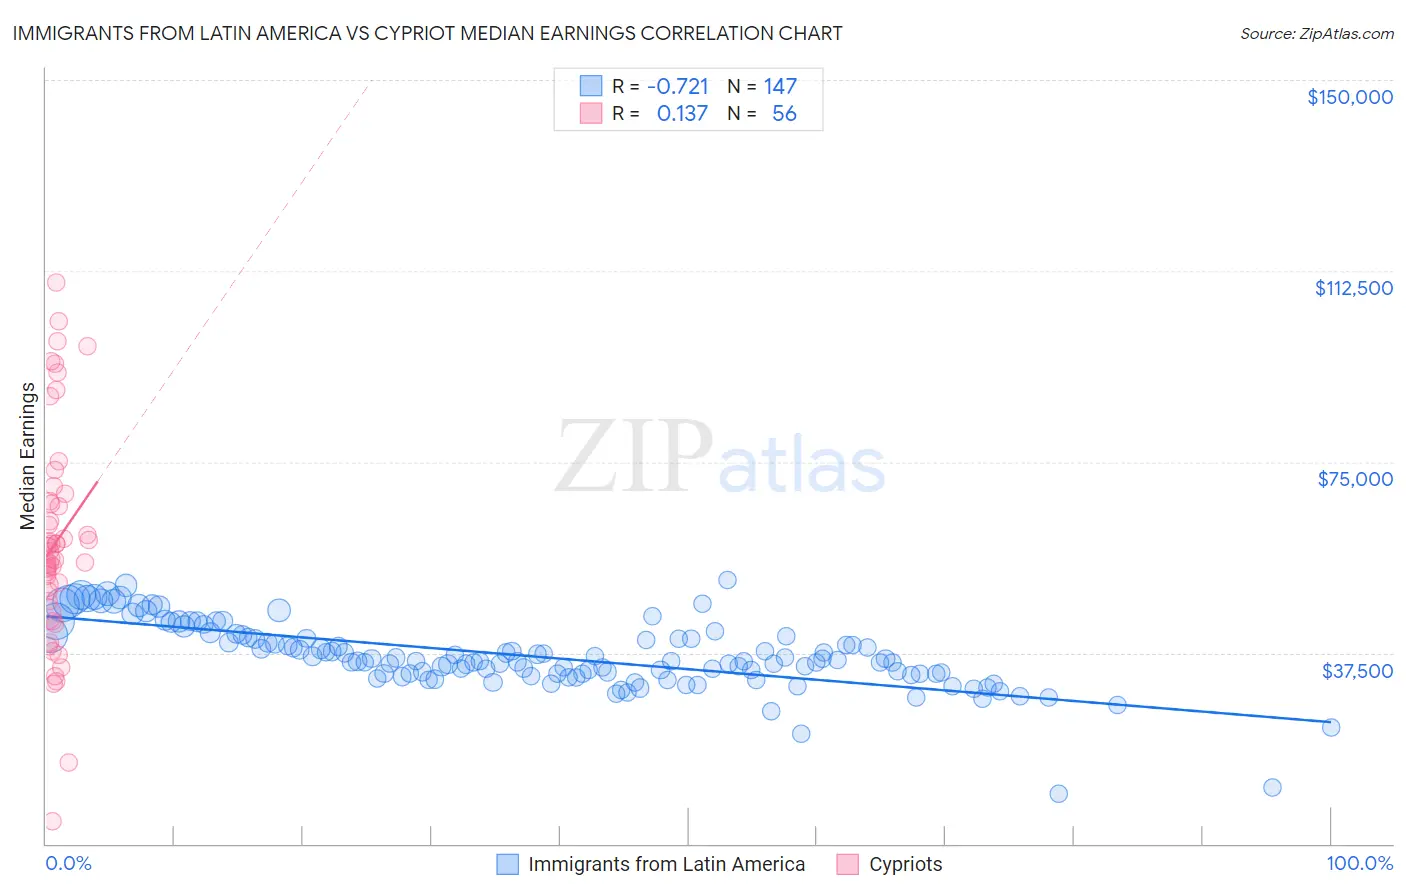
Immigrants from Latin America vs Cypriot Median Earnings Correlation Chart
The statistical analysis conducted on geographies consisting of 558,378,715 people shows a strong negative correlation between the proportion of Immigrants from Latin America and median earnings in the United States with a correlation coefficient (R) of -0.721 and weighted average of $41,049. Similarly, the statistical analysis conducted on geographies consisting of 61,853,771 people shows a poor positive correlation between the proportion of Cypriots and median earnings in the United States with a correlation coefficient (R) of 0.137 and weighted average of $54,589, a difference of 33.0%.
Median Earnings Correlation Summary
| Measurement | Immigrants from Latin America | Cypriot |
| Minimum | $9,917 | $4,333 |
| Maximum | $51,911 | $110,295 |
| Range | $41,994 | $105,962 |
| Mean | $36,860 | $59,088 |
| Median | $35,939 | $56,710 |
| Interquartile 25% (IQ1) | $33,290 | $48,668 |
| Interquartile 75% (IQ3) | $40,442 | $66,958 |
| Interquartile Range (IQR) | $7,152 | $18,291 |
| Standard Deviation (Sample) | $6,579 | $21,103 |
| Standard Deviation (Population) | $6,556 | $20,914 |
Similar Demographics by Median Earnings
Demographics Similar to Immigrants from Latin America by Median Earnings
In terms of median earnings, the demographic groups most similar to Immigrants from Latin America are Ute ($41,051, a difference of 0.010%), Immigrants from Caribbean ($41,119, a difference of 0.17%), Immigrants from Micronesia ($41,133, a difference of 0.20%), Shoshone ($40,932, a difference of 0.29%), and Haitian ($40,918, a difference of 0.32%).
| Demographics | Rating | Rank | Median Earnings |
| Potawatomi | 0.1 /100 | #294 | Tragic $41,288 |
| Bangladeshis | 0.1 /100 | #295 | Tragic $41,263 |
| Cherokee | 0.1 /100 | #296 | Tragic $41,252 |
| Guatemalans | 0.1 /100 | #297 | Tragic $41,205 |
| Immigrants | Micronesia | 0.1 /100 | #298 | Tragic $41,133 |
| Immigrants | Caribbean | 0.1 /100 | #299 | Tragic $41,119 |
| Ute | 0.1 /100 | #300 | Tragic $41,051 |
| Immigrants | Latin America | 0.1 /100 | #301 | Tragic $41,049 |
| Shoshone | 0.0 /100 | #302 | Tragic $40,932 |
| Haitians | 0.0 /100 | #303 | Tragic $40,918 |
| Immigrants | Guatemala | 0.0 /100 | #304 | Tragic $40,851 |
| Chickasaw | 0.0 /100 | #305 | Tragic $40,672 |
| Yaqui | 0.0 /100 | #306 | Tragic $40,647 |
| Hondurans | 0.0 /100 | #307 | Tragic $40,638 |
| Cubans | 0.0 /100 | #308 | Tragic $40,619 |
Demographics Similar to Cypriots by Median Earnings
In terms of median earnings, the demographic groups most similar to Cypriots are Burmese ($54,559, a difference of 0.060%), Immigrants from Korea ($54,530, a difference of 0.11%), Immigrants from Belgium ($54,679, a difference of 0.16%), Immigrants from Sweden ($54,478, a difference of 0.20%), and Soviet Union ($54,290, a difference of 0.55%).
| Demographics | Rating | Rank | Median Earnings |
| Immigrants | China | 100.0 /100 | #13 | Exceptional $56,638 |
| Immigrants | Australia | 100.0 /100 | #14 | Exceptional $56,305 |
| Indians (Asian) | 100.0 /100 | #15 | Exceptional $56,253 |
| Immigrants | Eastern Asia | 100.0 /100 | #16 | Exceptional $56,183 |
| Eastern Europeans | 100.0 /100 | #17 | Exceptional $55,084 |
| Immigrants | Japan | 100.0 /100 | #18 | Exceptional $54,938 |
| Immigrants | Belgium | 100.0 /100 | #19 | Exceptional $54,679 |
| Cypriots | 100.0 /100 | #20 | Exceptional $54,589 |
| Burmese | 100.0 /100 | #21 | Exceptional $54,559 |
| Immigrants | Korea | 100.0 /100 | #22 | Exceptional $54,530 |
| Immigrants | Sweden | 100.0 /100 | #23 | Exceptional $54,478 |
| Soviet Union | 100.0 /100 | #24 | Exceptional $54,290 |
| Turks | 100.0 /100 | #25 | Exceptional $53,919 |
| Immigrants | Northern Europe | 100.0 /100 | #26 | Exceptional $53,872 |
| Asians | 100.0 /100 | #27 | Exceptional $53,690 |