Iroquois vs British Householder Income Ages 25 - 44 years
COMPARE
Iroquois
British
Householder Income Ages 25 - 44 years
Householder Income Ages 25 - 44 years Comparison
Iroquois
British
$83,682
HOUSEHOLDER INCOME AGES 25 - 44 YEARS
0.2/ 100
METRIC RATING
273rd/ 347
METRIC RANK
$98,359
HOUSEHOLDER INCOME AGES 25 - 44 YEARS
89.1/ 100
METRIC RATING
126th/ 347
METRIC RANK
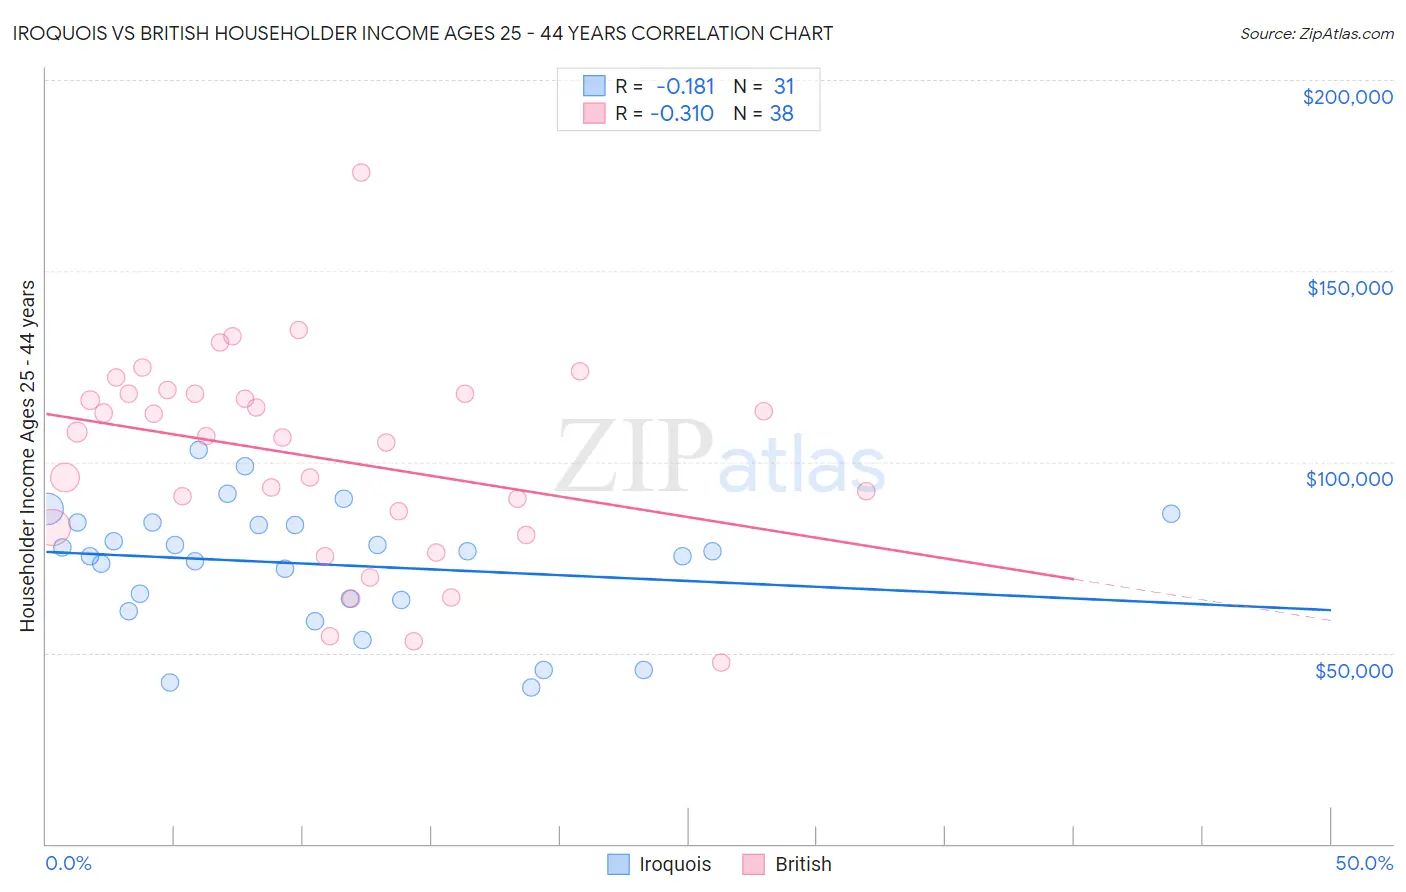
Iroquois vs British Householder Income Ages 25 - 44 years Correlation Chart
The statistical analysis conducted on geographies consisting of 207,014,213 people shows a poor negative correlation between the proportion of Iroquois and household income with householder between the ages 25 and 44 in the United States with a correlation coefficient (R) of -0.181 and weighted average of $83,682. Similarly, the statistical analysis conducted on geographies consisting of 528,162,005 people shows a mild negative correlation between the proportion of British and household income with householder between the ages 25 and 44 in the United States with a correlation coefficient (R) of -0.310 and weighted average of $98,359, a difference of 17.5%.
Householder Income Ages 25 - 44 years Correlation Summary
| Measurement | Iroquois | British |
| Minimum | $40,878 | $47,321 |
| Maximum | $102,951 | $175,781 |
| Range | $62,073 | $128,460 |
| Mean | $73,208 | $101,136 |
| Median | $76,438 | $106,554 |
| Interquartile 25% (IQ1) | $63,949 | $82,823 |
| Interquartile 75% (IQ3) | $84,029 | $117,796 |
| Interquartile Range (IQR) | $20,079 | $34,973 |
| Standard Deviation (Sample) | $16,006 | $26,587 |
| Standard Deviation (Population) | $15,746 | $26,235 |
Similar Demographics by Householder Income Ages 25 - 44 years
Demographics Similar to Iroquois by Householder Income Ages 25 - 44 years
In terms of householder income ages 25 - 44 years, the demographic groups most similar to Iroquois are Spanish American ($83,722, a difference of 0.050%), Somali ($83,752, a difference of 0.080%), Marshallese ($83,575, a difference of 0.13%), Jamaican ($83,933, a difference of 0.30%), and Immigrants from Jamaica ($83,298, a difference of 0.46%).
| Demographics | Rating | Rank | Householder Income Ages 25 - 44 years |
| Immigrants | Cabo Verde | 0.3 /100 | #266 | Tragic $84,304 |
| Hmong | 0.3 /100 | #267 | Tragic $84,258 |
| Sub-Saharan Africans | 0.3 /100 | #268 | Tragic $84,235 |
| Spanish American Indians | 0.3 /100 | #269 | Tragic $84,085 |
| Jamaicans | 0.3 /100 | #270 | Tragic $83,933 |
| Somalis | 0.2 /100 | #271 | Tragic $83,752 |
| Spanish Americans | 0.2 /100 | #272 | Tragic $83,722 |
| Iroquois | 0.2 /100 | #273 | Tragic $83,682 |
| Marshallese | 0.2 /100 | #274 | Tragic $83,575 |
| Immigrants | Jamaica | 0.2 /100 | #275 | Tragic $83,298 |
| Immigrants | Belize | 0.2 /100 | #276 | Tragic $83,141 |
| Paiute | 0.2 /100 | #277 | Tragic $82,984 |
| Senegalese | 0.2 /100 | #278 | Tragic $82,852 |
| Pima | 0.1 /100 | #279 | Tragic $82,821 |
| Colville | 0.1 /100 | #280 | Tragic $82,604 |
Demographics Similar to British by Householder Income Ages 25 - 44 years
In terms of householder income ages 25 - 44 years, the demographic groups most similar to British are Pakistani ($98,401, a difference of 0.040%), Serbian ($98,320, a difference of 0.040%), European ($98,310, a difference of 0.050%), Brazilian ($98,267, a difference of 0.090%), and Zimbabwean ($98,586, a difference of 0.23%).
| Demographics | Rating | Rank | Householder Income Ages 25 - 44 years |
| Jordanians | 92.8 /100 | #119 | Exceptional $99,186 |
| Swedes | 92.7 /100 | #120 | Exceptional $99,136 |
| Peruvians | 91.7 /100 | #121 | Exceptional $98,886 |
| Immigrants | Uzbekistan | 91.5 /100 | #122 | Exceptional $98,849 |
| Palestinians | 91.2 /100 | #123 | Exceptional $98,777 |
| Zimbabweans | 90.3 /100 | #124 | Exceptional $98,586 |
| Pakistanis | 89.3 /100 | #125 | Excellent $98,401 |
| British | 89.1 /100 | #126 | Excellent $98,359 |
| Serbians | 88.9 /100 | #127 | Excellent $98,320 |
| Europeans | 88.9 /100 | #128 | Excellent $98,310 |
| Brazilians | 88.6 /100 | #129 | Excellent $98,267 |
| Immigrants | Kuwait | 87.8 /100 | #130 | Excellent $98,122 |
| Immigrants | Albania | 86.6 /100 | #131 | Excellent $97,929 |
| Immigrants | Zimbabwe | 86.3 /100 | #132 | Excellent $97,880 |
| Tsimshian | 85.8 /100 | #133 | Excellent $97,809 |