Okinawan vs Immigrants from Burma/Myanmar Median Family Income
COMPARE
Okinawan
Immigrants from Burma/Myanmar
Median Family Income
Median Family Income Comparison
Okinawans
Immigrants from Burma/Myanmar
$129,979
MEDIAN FAMILY INCOME
100.0/ 100
METRIC RATING
9th/ 347
METRIC RANK
$94,472
MEDIAN FAMILY INCOME
1.5/ 100
METRIC RATING
235th/ 347
METRIC RANK
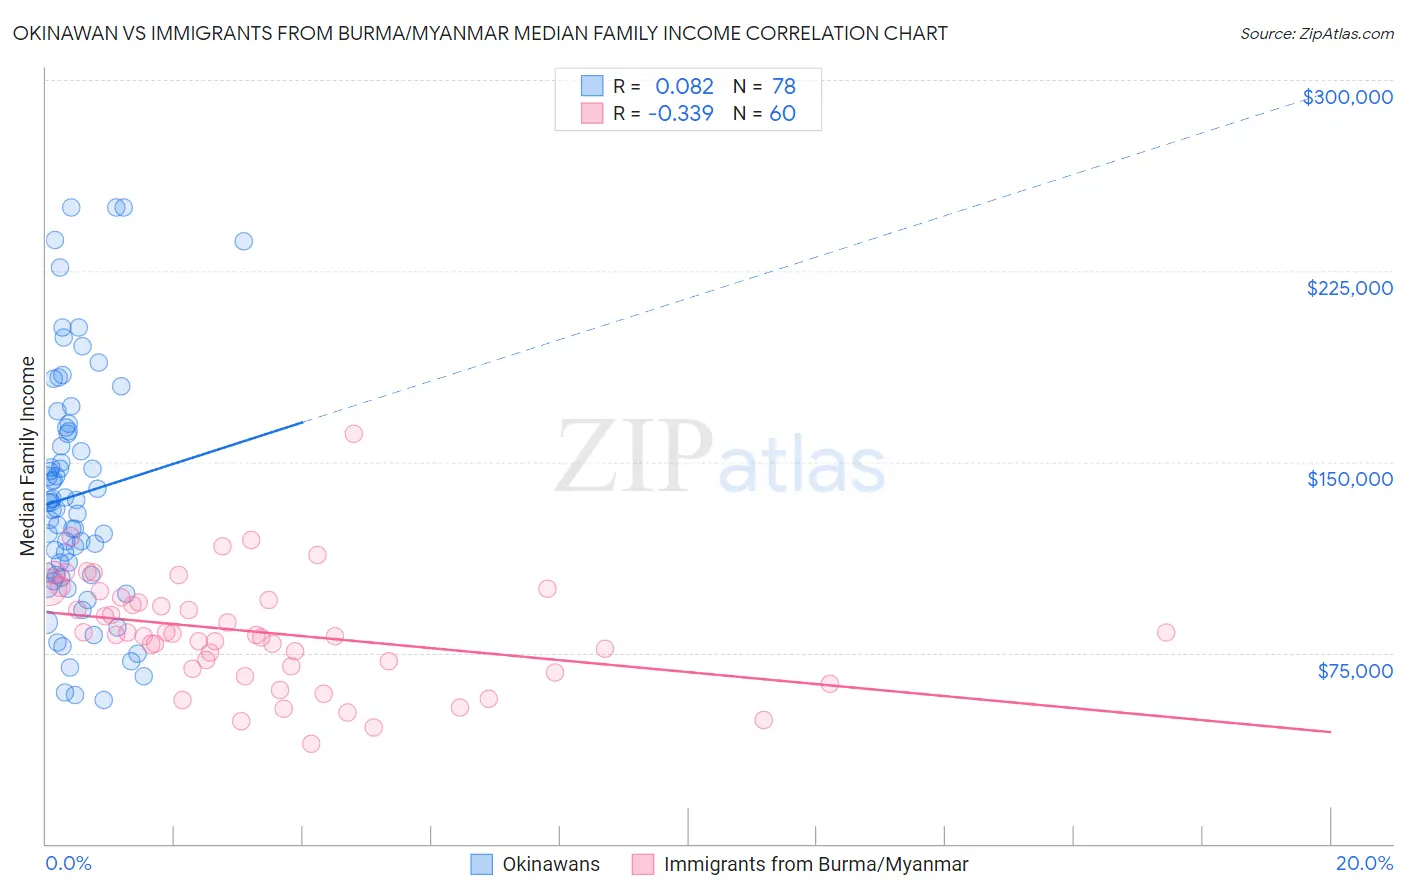
Okinawan vs Immigrants from Burma/Myanmar Median Family Income Correlation Chart
The statistical analysis conducted on geographies consisting of 73,711,216 people shows a slight positive correlation between the proportion of Okinawans and median family income in the United States with a correlation coefficient (R) of 0.082 and weighted average of $129,979. Similarly, the statistical analysis conducted on geographies consisting of 172,231,822 people shows a mild negative correlation between the proportion of Immigrants from Burma/Myanmar and median family income in the United States with a correlation coefficient (R) of -0.339 and weighted average of $94,472, a difference of 37.6%.
Median Family Income Correlation Summary
| Measurement | Okinawan | Immigrants from Burma/Myanmar |
| Minimum | $56,429 | $39,136 |
| Maximum | $250,001 | $160,863 |
| Range | $193,572 | $121,727 |
| Mean | $136,798 | $83,083 |
| Median | $132,761 | $82,122 |
| Interquartile 25% (IQ1) | $105,402 | $69,331 |
| Interquartile 75% (IQ3) | $161,875 | $96,286 |
| Interquartile Range (IQR) | $56,473 | $26,955 |
| Standard Deviation (Sample) | $46,889 | $21,974 |
| Standard Deviation (Population) | $46,587 | $21,790 |
Similar Demographics by Median Family Income
Demographics Similar to Okinawans by Median Family Income
In terms of median family income, the demographic groups most similar to Okinawans are Immigrants from Iran ($130,894, a difference of 0.70%), Immigrants from Hong Kong ($131,067, a difference of 0.84%), Thai ($131,281, a difference of 1.0%), Immigrants from Ireland ($127,584, a difference of 1.9%), and Immigrants from Israel ($127,430, a difference of 2.0%).
| Demographics | Rating | Rank | Median Family Income |
| Immigrants | Taiwan | 100.0 /100 | #2 | Exceptional $136,949 |
| Immigrants | Singapore | 100.0 /100 | #3 | Exceptional $134,818 |
| Immigrants | India | 100.0 /100 | #4 | Exceptional $134,028 |
| Iranians | 100.0 /100 | #5 | Exceptional $133,839 |
| Thais | 100.0 /100 | #6 | Exceptional $131,281 |
| Immigrants | Hong Kong | 100.0 /100 | #7 | Exceptional $131,067 |
| Immigrants | Iran | 100.0 /100 | #8 | Exceptional $130,894 |
| Okinawans | 100.0 /100 | #9 | Exceptional $129,979 |
| Immigrants | Ireland | 100.0 /100 | #10 | Exceptional $127,584 |
| Immigrants | Israel | 100.0 /100 | #11 | Exceptional $127,430 |
| Cypriots | 100.0 /100 | #12 | Exceptional $127,064 |
| Immigrants | Australia | 100.0 /100 | #13 | Exceptional $126,620 |
| Immigrants | South Central Asia | 100.0 /100 | #14 | Exceptional $125,956 |
| Eastern Europeans | 100.0 /100 | #15 | Exceptional $125,546 |
| Immigrants | China | 100.0 /100 | #16 | Exceptional $125,540 |
Demographics Similar to Immigrants from Burma/Myanmar by Median Family Income
In terms of median family income, the demographic groups most similar to Immigrants from Burma/Myanmar are Trinidadian and Tobagonian ($94,466, a difference of 0.010%), Alaskan Athabascan ($94,429, a difference of 0.040%), Immigrants from Western Africa ($94,638, a difference of 0.18%), Immigrants from Bangladesh ($94,665, a difference of 0.20%), and Nepalese ($94,153, a difference of 0.34%).
| Demographics | Rating | Rank | Median Family Income |
| Immigrants | Azores | 2.4 /100 | #228 | Tragic $95,402 |
| Marshallese | 2.2 /100 | #229 | Tragic $95,293 |
| Malaysians | 2.2 /100 | #230 | Tragic $95,230 |
| Ecuadorians | 2.1 /100 | #231 | Tragic $95,114 |
| Immigrants | Venezuela | 1.9 /100 | #232 | Tragic $94,904 |
| Immigrants | Bangladesh | 1.6 /100 | #233 | Tragic $94,665 |
| Immigrants | Western Africa | 1.6 /100 | #234 | Tragic $94,638 |
| Immigrants | Burma/Myanmar | 1.5 /100 | #235 | Tragic $94,472 |
| Trinidadians and Tobagonians | 1.5 /100 | #236 | Tragic $94,466 |
| Alaskan Athabascans | 1.5 /100 | #237 | Tragic $94,429 |
| Nepalese | 1.3 /100 | #238 | Tragic $94,153 |
| Salvadorans | 1.2 /100 | #239 | Tragic $94,109 |
| Somalis | 1.2 /100 | #240 | Tragic $94,085 |
| Immigrants | Trinidad and Tobago | 1.2 /100 | #241 | Tragic $93,988 |
| Barbadians | 1.1 /100 | #242 | Tragic $93,919 |