Spanish American Indian vs Immigrants from Singapore Median Family Income
COMPARE
Spanish American Indian
Immigrants from Singapore
Median Family Income
Median Family Income Comparison
Spanish American Indians
Immigrants from Singapore
$85,728
MEDIAN FAMILY INCOME
0.0/ 100
METRIC RATING
302nd/ 347
METRIC RANK
$134,818
MEDIAN FAMILY INCOME
100.0/ 100
METRIC RATING
3rd/ 347
METRIC RANK
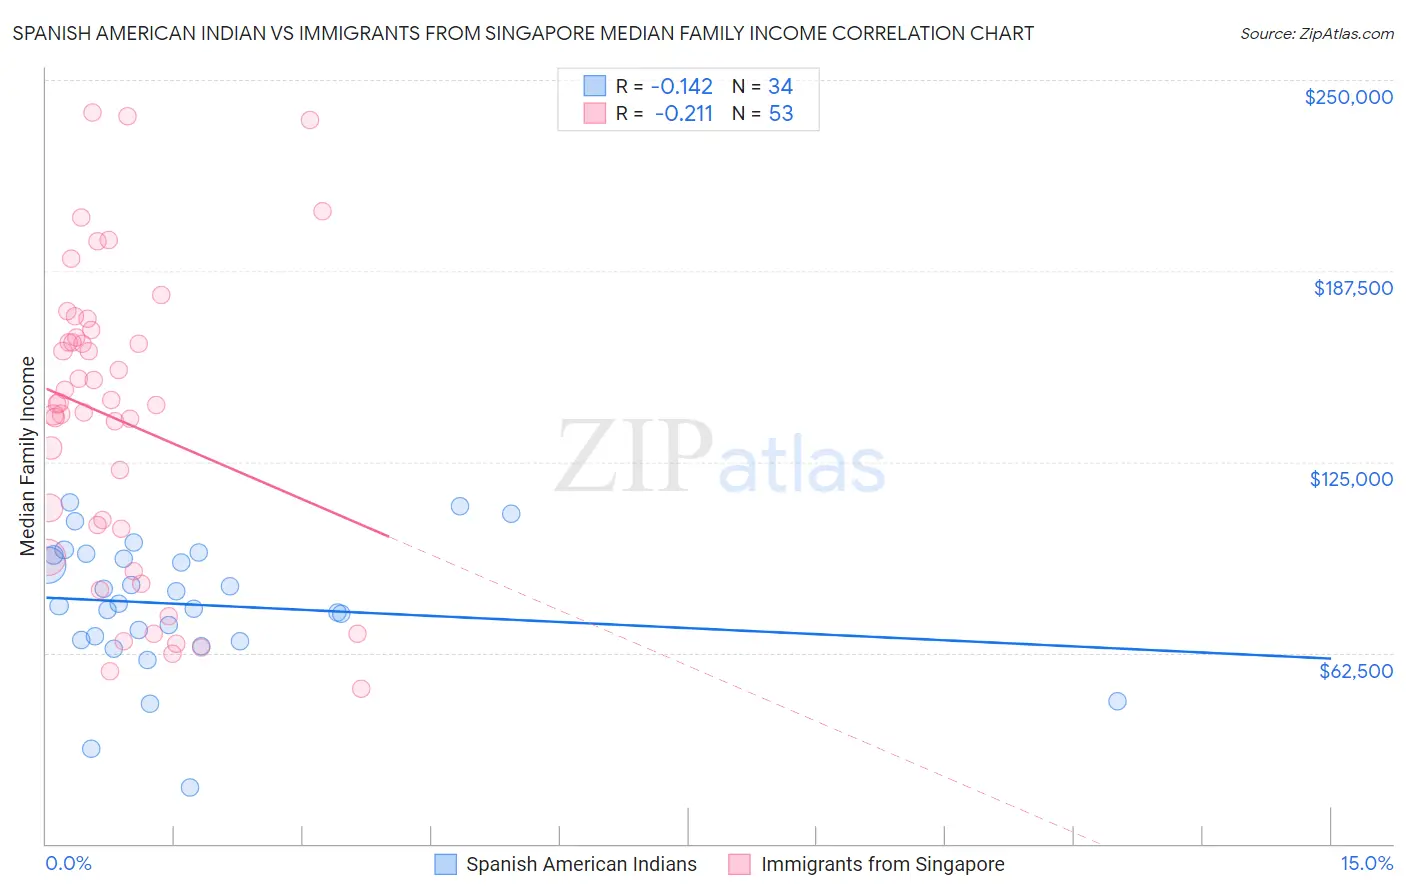
Spanish American Indian vs Immigrants from Singapore Median Family Income Correlation Chart
The statistical analysis conducted on geographies consisting of 73,144,470 people shows a poor negative correlation between the proportion of Spanish American Indians and median family income in the United States with a correlation coefficient (R) of -0.142 and weighted average of $85,728. Similarly, the statistical analysis conducted on geographies consisting of 137,416,913 people shows a weak negative correlation between the proportion of Immigrants from Singapore and median family income in the United States with a correlation coefficient (R) of -0.211 and weighted average of $134,818, a difference of 57.3%.
Median Family Income Correlation Summary
| Measurement | Spanish American Indian | Immigrants from Singapore |
| Minimum | $18,487 | $50,694 |
| Maximum | $111,586 | $239,159 |
| Range | $93,099 | $188,465 |
| Mean | $78,286 | $138,690 |
| Median | $78,276 | $144,010 |
| Interquartile 25% (IQ1) | $66,839 | $98,407 |
| Interquartile 75% (IQ3) | $94,568 | $166,932 |
| Interquartile Range (IQR) | $27,730 | $68,525 |
| Standard Deviation (Sample) | $21,408 | $49,034 |
| Standard Deviation (Population) | $21,091 | $48,569 |
Similar Demographics by Median Family Income
Demographics Similar to Spanish American Indians by Median Family Income
In terms of median family income, the demographic groups most similar to Spanish American Indians are Colville ($85,792, a difference of 0.070%), Hispanic or Latino ($85,647, a difference of 0.090%), Mexican ($85,618, a difference of 0.13%), Paiute ($85,414, a difference of 0.37%), and Immigrants from Dominica ($85,411, a difference of 0.37%).
| Demographics | Rating | Rank | Median Family Income |
| Yaqui | 0.0 /100 | #295 | Tragic $87,289 |
| Immigrants | Guatemala | 0.0 /100 | #296 | Tragic $87,191 |
| Cajuns | 0.0 /100 | #297 | Tragic $87,157 |
| Immigrants | Latin America | 0.0 /100 | #298 | Tragic $86,989 |
| Chippewa | 0.0 /100 | #299 | Tragic $86,852 |
| Ottawa | 0.0 /100 | #300 | Tragic $86,380 |
| Colville | 0.0 /100 | #301 | Tragic $85,792 |
| Spanish American Indians | 0.0 /100 | #302 | Tragic $85,728 |
| Hispanics or Latinos | 0.0 /100 | #303 | Tragic $85,647 |
| Mexicans | 0.0 /100 | #304 | Tragic $85,618 |
| Paiute | 0.0 /100 | #305 | Tragic $85,414 |
| Immigrants | Dominica | 0.0 /100 | #306 | Tragic $85,411 |
| Chickasaw | 0.0 /100 | #307 | Tragic $85,356 |
| U.S. Virgin Islanders | 0.0 /100 | #308 | Tragic $85,294 |
| Haitians | 0.0 /100 | #309 | Tragic $85,218 |
Demographics Similar to Immigrants from Singapore by Median Family Income
In terms of median family income, the demographic groups most similar to Immigrants from Singapore are Immigrants from India ($134,028, a difference of 0.59%), Iranian ($133,839, a difference of 0.73%), Immigrants from Taiwan ($136,949, a difference of 1.6%), Filipino ($138,397, a difference of 2.6%), and Thai ($131,281, a difference of 2.7%).
| Demographics | Rating | Rank | Median Family Income |
| Filipinos | 100.0 /100 | #1 | Exceptional $138,397 |
| Immigrants | Taiwan | 100.0 /100 | #2 | Exceptional $136,949 |
| Immigrants | Singapore | 100.0 /100 | #3 | Exceptional $134,818 |
| Immigrants | India | 100.0 /100 | #4 | Exceptional $134,028 |
| Iranians | 100.0 /100 | #5 | Exceptional $133,839 |
| Thais | 100.0 /100 | #6 | Exceptional $131,281 |
| Immigrants | Hong Kong | 100.0 /100 | #7 | Exceptional $131,067 |
| Immigrants | Iran | 100.0 /100 | #8 | Exceptional $130,894 |
| Okinawans | 100.0 /100 | #9 | Exceptional $129,979 |
| Immigrants | Ireland | 100.0 /100 | #10 | Exceptional $127,584 |
| Immigrants | Israel | 100.0 /100 | #11 | Exceptional $127,430 |
| Cypriots | 100.0 /100 | #12 | Exceptional $127,064 |
| Immigrants | Australia | 100.0 /100 | #13 | Exceptional $126,620 |
| Immigrants | South Central Asia | 100.0 /100 | #14 | Exceptional $125,956 |
| Eastern Europeans | 100.0 /100 | #15 | Exceptional $125,546 |