Iranian vs Immigrants from Iraq Householder Income Over 65 years
COMPARE
Iranian
Immigrants from Iraq
Householder Income Over 65 years
Householder Income Over 65 years Comparison
Iranians
Immigrants from Iraq
$77,429
HOUSEHOLDER INCOME OVER 65 YEARS
100.0/ 100
METRIC RATING
2nd/ 347
METRIC RANK
$59,824
HOUSEHOLDER INCOME OVER 65 YEARS
23.2/ 100
METRIC RATING
195th/ 347
METRIC RANK
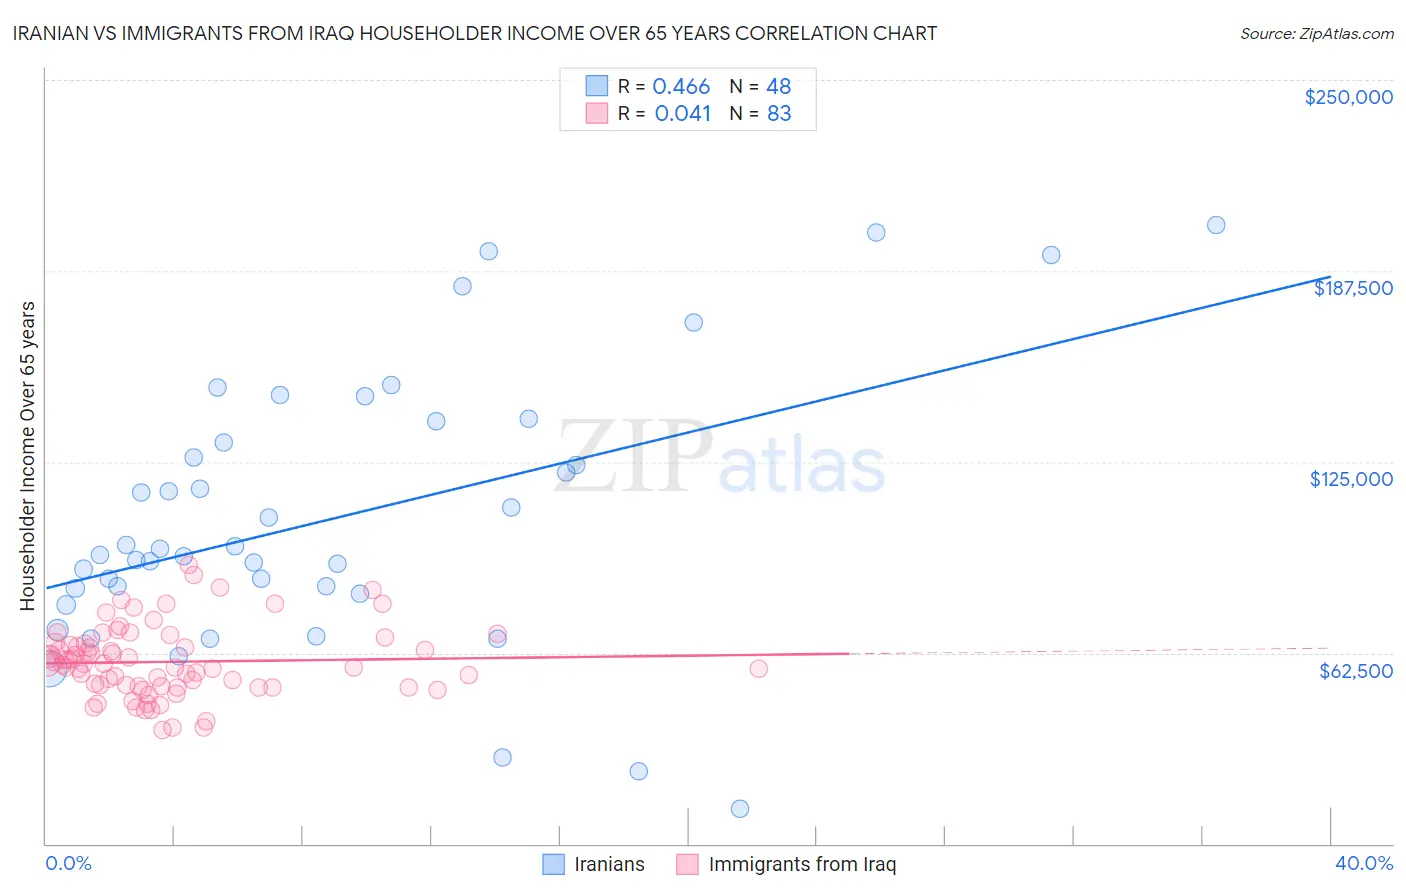
Iranian vs Immigrants from Iraq Householder Income Over 65 years Correlation Chart
The statistical analysis conducted on geographies consisting of 316,043,836 people shows a moderate positive correlation between the proportion of Iranians and household income with householder over the age of 65 in the United States with a correlation coefficient (R) of 0.466 and weighted average of $77,429. Similarly, the statistical analysis conducted on geographies consisting of 194,612,135 people shows no correlation between the proportion of Immigrants from Iraq and household income with householder over the age of 65 in the United States with a correlation coefficient (R) of 0.041 and weighted average of $59,824, a difference of 29.4%.
Householder Income Over 65 years Correlation Summary
| Measurement | Iranian | Immigrants from Iraq |
| Minimum | $11,563 | $37,148 |
| Maximum | $202,500 | $91,250 |
| Range | $190,937 | $54,102 |
| Mean | $106,815 | $59,538 |
| Median | $95,602 | $58,855 |
| Interquartile 25% (IQ1) | $82,658 | $51,355 |
| Interquartile 75% (IQ3) | $134,972 | $65,529 |
| Interquartile Range (IQR) | $52,314 | $14,174 |
| Standard Deviation (Sample) | $44,529 | $11,528 |
| Standard Deviation (Population) | $44,062 | $11,458 |
Similar Demographics by Householder Income Over 65 years
Demographics Similar to Iranians by Householder Income Over 65 years
In terms of householder income over 65 years, the demographic groups most similar to Iranians are Chinese ($77,465, a difference of 0.050%), Immigrants from Taiwan ($77,051, a difference of 0.49%), Filipino ($76,686, a difference of 0.97%), Immigrants from Iran ($75,081, a difference of 3.1%), and Bolivian ($74,245, a difference of 4.3%).
| Demographics | Rating | Rank | Householder Income Over 65 years |
| Chinese | 100.0 /100 | #1 | Exceptional $77,465 |
| Iranians | 100.0 /100 | #2 | Exceptional $77,429 |
| Immigrants | Taiwan | 100.0 /100 | #3 | Exceptional $77,051 |
| Filipinos | 100.0 /100 | #4 | Exceptional $76,686 |
| Immigrants | Iran | 100.0 /100 | #5 | Exceptional $75,081 |
| Bolivians | 100.0 /100 | #6 | Exceptional $74,245 |
| Immigrants | Bolivia | 100.0 /100 | #7 | Exceptional $73,434 |
| Immigrants | Singapore | 100.0 /100 | #8 | Exceptional $72,963 |
| Immigrants | India | 100.0 /100 | #9 | Exceptional $72,804 |
| Bhutanese | 100.0 /100 | #10 | Exceptional $72,288 |
| Thais | 100.0 /100 | #11 | Exceptional $72,099 |
| Cypriots | 100.0 /100 | #12 | Exceptional $71,714 |
| Immigrants | Hong Kong | 100.0 /100 | #13 | Exceptional $71,567 |
| Burmese | 100.0 /100 | #14 | Exceptional $71,139 |
| Native Hawaiians | 100.0 /100 | #15 | Exceptional $71,021 |
Demographics Similar to Immigrants from Iraq by Householder Income Over 65 years
In terms of householder income over 65 years, the demographic groups most similar to Immigrants from Iraq are Immigrants from Africa ($59,837, a difference of 0.020%), Immigrants from Costa Rica ($59,848, a difference of 0.040%), South American ($59,854, a difference of 0.050%), Belgian ($59,915, a difference of 0.15%), and German ($59,730, a difference of 0.16%).
| Demographics | Rating | Rank | Householder Income Over 65 years |
| Immigrants | Eritrea | 28.6 /100 | #188 | Fair $60,096 |
| Ghanaians | 27.5 /100 | #189 | Fair $60,043 |
| Puget Sound Salish | 25.3 /100 | #190 | Fair $59,934 |
| Belgians | 24.9 /100 | #191 | Fair $59,915 |
| South Americans | 23.8 /100 | #192 | Fair $59,854 |
| Immigrants | Costa Rica | 23.6 /100 | #193 | Fair $59,848 |
| Immigrants | Africa | 23.4 /100 | #194 | Fair $59,837 |
| Immigrants | Iraq | 23.2 /100 | #195 | Fair $59,824 |
| Germans | 21.5 /100 | #196 | Fair $59,730 |
| Immigrants | Kenya | 21.1 /100 | #197 | Fair $59,710 |
| Moroccans | 20.7 /100 | #198 | Fair $59,683 |
| Immigrants | Immigrants | 20.2 /100 | #199 | Fair $59,656 |
| French | 20.2 /100 | #200 | Fair $59,656 |
| Dutch | 18.3 /100 | #201 | Poor $59,539 |
| Finns | 18.2 /100 | #202 | Poor $59,535 |