Dominican vs Menominee Householder Income Over 65 years
COMPARE
Dominican
Menominee
Householder Income Over 65 years
Householder Income Over 65 years Comparison
Dominicans
Menominee
$46,964
HOUSEHOLDER INCOME OVER 65 YEARS
0.0/ 100
METRIC RATING
341st/ 347
METRIC RANK
$51,719
HOUSEHOLDER INCOME OVER 65 YEARS
0.0/ 100
METRIC RATING
321st/ 347
METRIC RANK
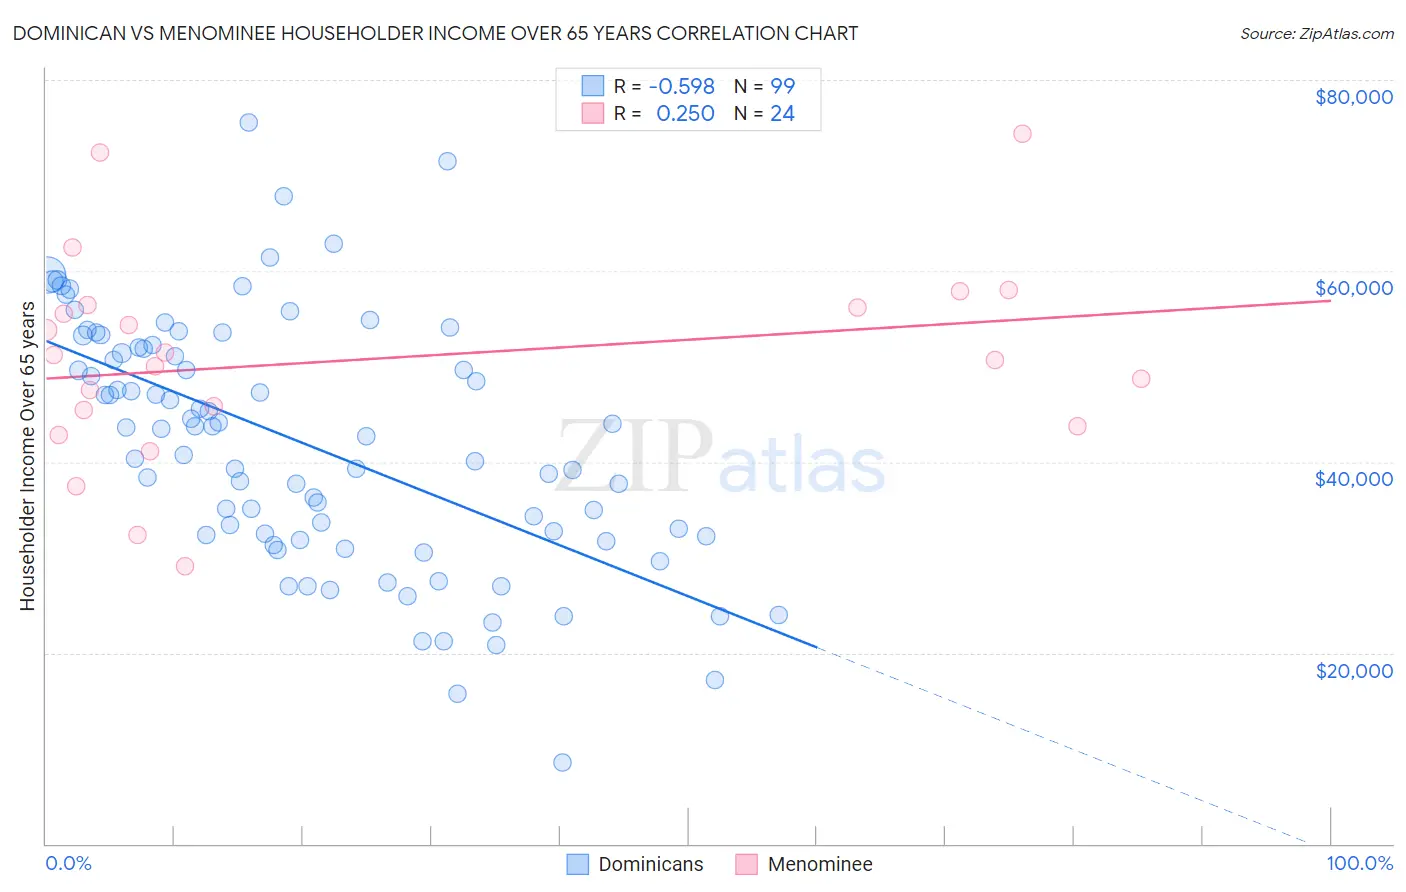
Dominican vs Menominee Householder Income Over 65 years Correlation Chart
The statistical analysis conducted on geographies consisting of 353,452,286 people shows a substantial negative correlation between the proportion of Dominicans and household income with householder over the age of 65 in the United States with a correlation coefficient (R) of -0.598 and weighted average of $46,964. Similarly, the statistical analysis conducted on geographies consisting of 45,767,067 people shows a weak positive correlation between the proportion of Menominee and household income with householder over the age of 65 in the United States with a correlation coefficient (R) of 0.250 and weighted average of $51,719, a difference of 10.1%.
Householder Income Over 65 years Correlation Summary
| Measurement | Dominican | Menominee |
| Minimum | $8,529 | $29,125 |
| Maximum | $75,483 | $74,432 |
| Range | $66,954 | $45,307 |
| Mean | $41,882 | $50,793 |
| Median | $43,498 | $50,939 |
| Interquartile 25% (IQ1) | $32,229 | $44,602 |
| Interquartile 75% (IQ3) | $52,008 | $56,259 |
| Interquartile Range (IQR) | $19,779 | $11,657 |
| Standard Deviation (Sample) | $13,021 | $10,695 |
| Standard Deviation (Population) | $12,955 | $10,470 |
Demographics Similar to Dominicans and Menominee by Householder Income Over 65 years
In terms of householder income over 65 years, the demographic groups most similar to Dominicans are Immigrants from Yemen ($47,527, a difference of 1.2%), Navajo ($47,722, a difference of 1.6%), Immigrants from Caribbean ($48,535, a difference of 3.3%), Tohono O'odham ($49,121, a difference of 4.6%), and Cuban ($49,152, a difference of 4.7%). Similarly, the demographic groups most similar to Menominee are British West Indian ($51,463, a difference of 0.50%), Cajun ($51,397, a difference of 0.63%), Immigrants from Congo ($51,393, a difference of 0.63%), Immigrants from Haiti ($51,219, a difference of 0.97%), and Kiowa ($51,140, a difference of 1.1%).
| Demographics | Rating | Rank | Householder Income Over 65 years |
| Menominee | 0.0 /100 | #321 | Tragic $51,719 |
| British West Indians | 0.0 /100 | #322 | Tragic $51,463 |
| Cajuns | 0.0 /100 | #323 | Tragic $51,397 |
| Immigrants | Congo | 0.0 /100 | #324 | Tragic $51,393 |
| Immigrants | Haiti | 0.0 /100 | #325 | Tragic $51,219 |
| Kiowa | 0.0 /100 | #326 | Tragic $51,140 |
| Bahamians | 0.0 /100 | #327 | Tragic $51,000 |
| Hopi | 0.0 /100 | #328 | Tragic $50,925 |
| Blacks/African Americans | 0.0 /100 | #329 | Tragic $50,779 |
| Immigrants | Grenada | 0.0 /100 | #330 | Tragic $50,747 |
| Pima | 0.0 /100 | #331 | Tragic $50,539 |
| Dutch West Indians | 0.0 /100 | #332 | Tragic $50,475 |
| Cape Verdeans | 0.0 /100 | #333 | Tragic $50,077 |
| Immigrants | Dominica | 0.0 /100 | #334 | Tragic $50,071 |
| Crow | 0.0 /100 | #335 | Tragic $49,234 |
| Cubans | 0.0 /100 | #336 | Tragic $49,152 |
| Tohono O'odham | 0.0 /100 | #337 | Tragic $49,121 |
| Immigrants | Caribbean | 0.0 /100 | #338 | Tragic $48,535 |
| Navajo | 0.0 /100 | #339 | Tragic $47,722 |
| Immigrants | Yemen | 0.0 /100 | #340 | Tragic $47,527 |
| Dominicans | 0.0 /100 | #341 | Tragic $46,964 |