French vs Immigrants from Peru Median Female Earnings
COMPARE
French
Immigrants from Peru
Median Female Earnings
Median Female Earnings Comparison
French
Immigrants from Peru
$38,457
MEDIAN FEMALE EARNINGS
7.0/ 100
METRIC RATING
225th/ 347
METRIC RANK
$39,871
MEDIAN FEMALE EARNINGS
58.9/ 100
METRIC RATING
168th/ 347
METRIC RANK
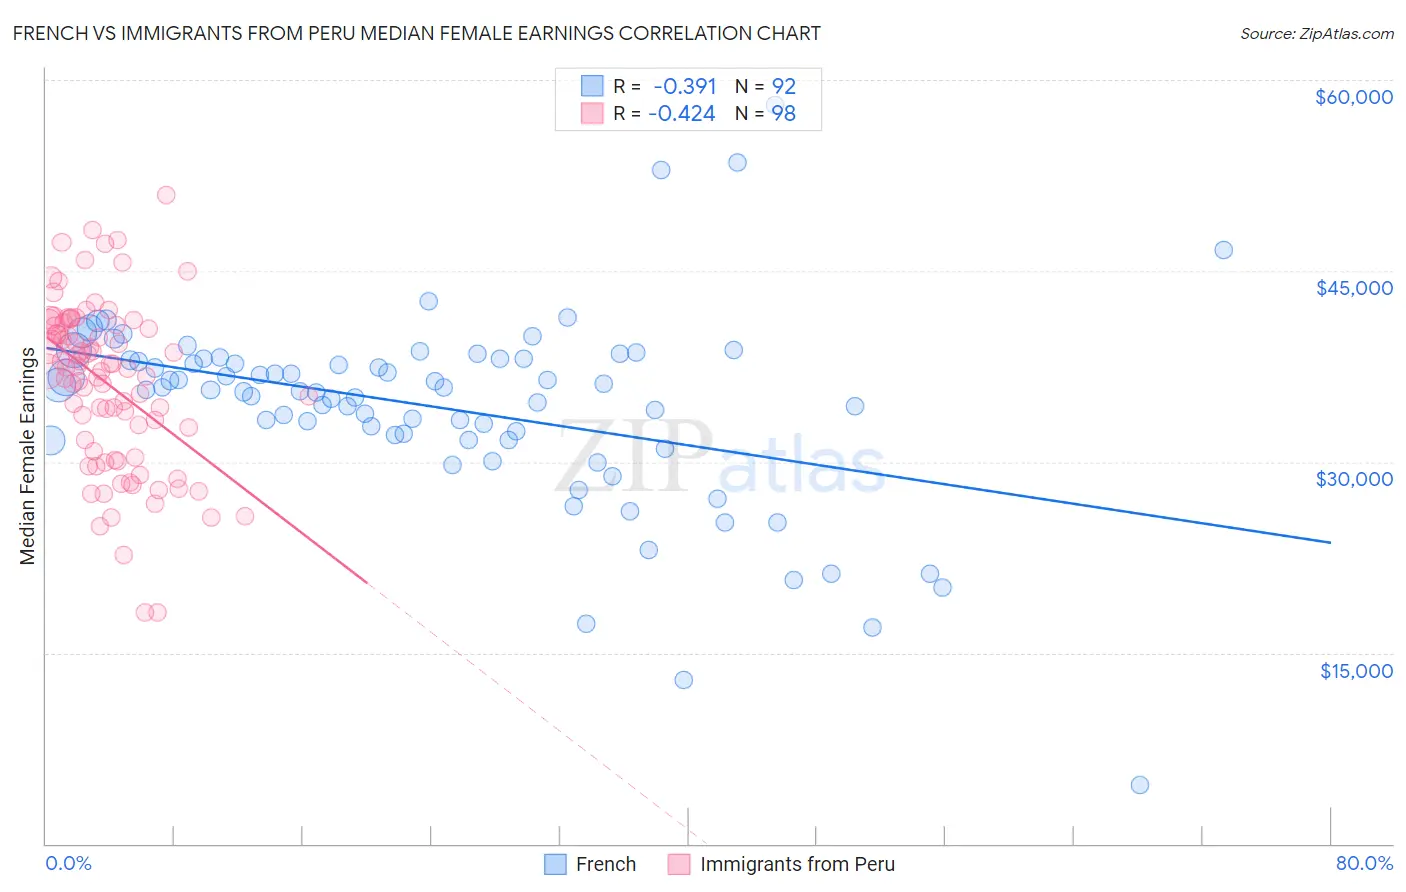
French vs Immigrants from Peru Median Female Earnings Correlation Chart
The statistical analysis conducted on geographies consisting of 570,640,239 people shows a mild negative correlation between the proportion of French and median female earnings in the United States with a correlation coefficient (R) of -0.391 and weighted average of $38,457. Similarly, the statistical analysis conducted on geographies consisting of 328,788,415 people shows a moderate negative correlation between the proportion of Immigrants from Peru and median female earnings in the United States with a correlation coefficient (R) of -0.424 and weighted average of $39,871, a difference of 3.7%.
Median Female Earnings Correlation Summary
| Measurement | French | Immigrants from Peru |
| Minimum | $4,625 | $18,150 |
| Maximum | $58,008 | $50,975 |
| Range | $53,383 | $32,825 |
| Mean | $34,289 | $36,171 |
| Median | $35,683 | $37,366 |
| Interquartile 25% (IQ1) | $31,891 | $30,816 |
| Interquartile 75% (IQ3) | $38,063 | $40,742 |
| Interquartile Range (IQR) | $6,171 | $9,926 |
| Standard Deviation (Sample) | $7,750 | $6,551 |
| Standard Deviation (Population) | $7,708 | $6,517 |
Similar Demographics by Median Female Earnings
Demographics Similar to French by Median Female Earnings
In terms of median female earnings, the demographic groups most similar to French are Native Hawaiian ($38,461, a difference of 0.010%), French Canadian ($38,436, a difference of 0.050%), Immigrants from Sudan ($38,511, a difference of 0.14%), Scottish ($38,397, a difference of 0.15%), and Subsaharan African ($38,391, a difference of 0.17%).
| Demographics | Rating | Rank | Median Female Earnings |
| Cape Verdeans | 9.5 /100 | #218 | Tragic $38,614 |
| Nepalese | 9.3 /100 | #219 | Tragic $38,603 |
| Yugoslavians | 8.8 /100 | #220 | Tragic $38,573 |
| Immigrants | Azores | 8.8 /100 | #221 | Tragic $38,573 |
| Japanese | 8.1 /100 | #222 | Tragic $38,528 |
| Immigrants | Sudan | 7.8 /100 | #223 | Tragic $38,511 |
| Native Hawaiians | 7.1 /100 | #224 | Tragic $38,461 |
| French | 7.0 /100 | #225 | Tragic $38,457 |
| French Canadians | 6.8 /100 | #226 | Tragic $38,436 |
| Scottish | 6.3 /100 | #227 | Tragic $38,397 |
| Sub-Saharan Africans | 6.2 /100 | #228 | Tragic $38,391 |
| Belgians | 6.1 /100 | #229 | Tragic $38,382 |
| Basques | 5.7 /100 | #230 | Tragic $38,352 |
| Somalis | 5.5 /100 | #231 | Tragic $38,333 |
| Scandinavians | 5.2 /100 | #232 | Tragic $38,306 |
Demographics Similar to Immigrants from Peru by Median Female Earnings
In terms of median female earnings, the demographic groups most similar to Immigrants from Peru are Kenyan ($39,860, a difference of 0.030%), Luxembourger ($39,891, a difference of 0.050%), Immigrants from Ghana ($39,894, a difference of 0.060%), Immigrants from Bangladesh ($39,910, a difference of 0.10%), and Slovene ($39,817, a difference of 0.13%).
| Demographics | Rating | Rank | Median Female Earnings |
| Alsatians | 68.0 /100 | #161 | Good $40,060 |
| South American Indians | 66.1 /100 | #162 | Good $40,019 |
| Lebanese | 65.5 /100 | #163 | Good $40,006 |
| Immigrants | Saudi Arabia | 62.9 /100 | #164 | Good $39,952 |
| Immigrants | Bangladesh | 60.8 /100 | #165 | Good $39,910 |
| Immigrants | Ghana | 60.0 /100 | #166 | Good $39,894 |
| Luxembourgers | 59.9 /100 | #167 | Average $39,891 |
| Immigrants | Peru | 58.9 /100 | #168 | Average $39,871 |
| Kenyans | 58.4 /100 | #169 | Average $39,860 |
| Slovenes | 56.2 /100 | #170 | Average $39,817 |
| Immigrants | Portugal | 54.7 /100 | #171 | Average $39,788 |
| British | 53.8 /100 | #172 | Average $39,772 |
| Canadians | 51.4 /100 | #173 | Average $39,724 |
| South Americans | 50.0 /100 | #174 | Average $39,698 |
| Immigrants | South America | 47.2 /100 | #175 | Average $39,643 |