Spanish American Indian vs Immigrants from Peru Median Female Earnings
COMPARE
Spanish American Indian
Immigrants from Peru
Median Female Earnings
Median Female Earnings Comparison
Spanish American Indians
Immigrants from Peru
$33,625
MEDIAN FEMALE EARNINGS
0.0/ 100
METRIC RATING
334th/ 347
METRIC RANK
$39,871
MEDIAN FEMALE EARNINGS
58.9/ 100
METRIC RATING
168th/ 347
METRIC RANK
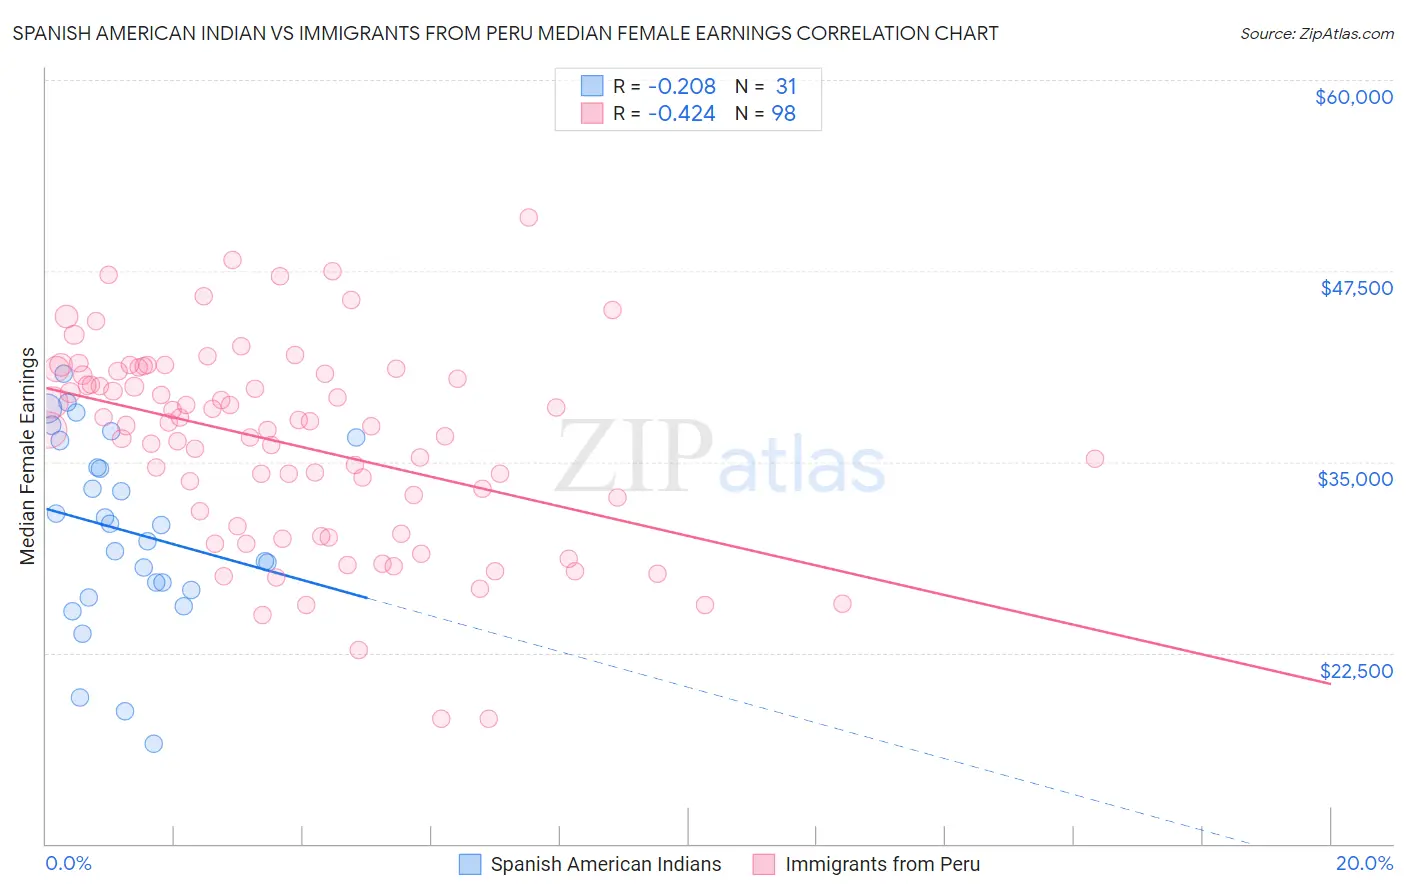
Spanish American Indian vs Immigrants from Peru Median Female Earnings Correlation Chart
The statistical analysis conducted on geographies consisting of 73,144,962 people shows a weak negative correlation between the proportion of Spanish American Indians and median female earnings in the United States with a correlation coefficient (R) of -0.208 and weighted average of $33,625. Similarly, the statistical analysis conducted on geographies consisting of 328,788,415 people shows a moderate negative correlation between the proportion of Immigrants from Peru and median female earnings in the United States with a correlation coefficient (R) of -0.424 and weighted average of $39,871, a difference of 18.6%.
Median Female Earnings Correlation Summary
| Measurement | Spanish American Indian | Immigrants from Peru |
| Minimum | $16,510 | $18,150 |
| Maximum | $40,753 | $50,975 |
| Range | $24,243 | $32,825 |
| Mean | $30,468 | $36,171 |
| Median | $30,907 | $37,366 |
| Interquartile 25% (IQ1) | $26,648 | $30,816 |
| Interquartile 75% (IQ3) | $36,401 | $40,742 |
| Interquartile Range (IQR) | $9,753 | $9,926 |
| Standard Deviation (Sample) | $6,157 | $6,551 |
| Standard Deviation (Population) | $6,057 | $6,517 |
Similar Demographics by Median Female Earnings
Demographics Similar to Spanish American Indians by Median Female Earnings
In terms of median female earnings, the demographic groups most similar to Spanish American Indians are Mexican ($33,664, a difference of 0.12%), Choctaw ($33,775, a difference of 0.45%), Native/Alaskan ($33,806, a difference of 0.54%), Creek ($33,437, a difference of 0.56%), and Ottawa ($33,378, a difference of 0.74%).
| Demographics | Rating | Rank | Median Female Earnings |
| Cajuns | 0.0 /100 | #327 | Tragic $34,034 |
| Immigrants | Central America | 0.0 /100 | #328 | Tragic $33,953 |
| Hopi | 0.0 /100 | #329 | Tragic $33,932 |
| Menominee | 0.0 /100 | #330 | Tragic $33,894 |
| Natives/Alaskans | 0.0 /100 | #331 | Tragic $33,806 |
| Choctaw | 0.0 /100 | #332 | Tragic $33,775 |
| Mexicans | 0.0 /100 | #333 | Tragic $33,664 |
| Spanish American Indians | 0.0 /100 | #334 | Tragic $33,625 |
| Creek | 0.0 /100 | #335 | Tragic $33,437 |
| Ottawa | 0.0 /100 | #336 | Tragic $33,378 |
| Yakama | 0.0 /100 | #337 | Tragic $33,354 |
| Immigrants | Cuba | 0.0 /100 | #338 | Tragic $33,291 |
| Immigrants | Mexico | 0.0 /100 | #339 | Tragic $33,236 |
| Tohono O'odham | 0.0 /100 | #340 | Tragic $33,205 |
| Navajo | 0.0 /100 | #341 | Tragic $33,046 |
Demographics Similar to Immigrants from Peru by Median Female Earnings
In terms of median female earnings, the demographic groups most similar to Immigrants from Peru are Kenyan ($39,860, a difference of 0.030%), Luxembourger ($39,891, a difference of 0.050%), Immigrants from Ghana ($39,894, a difference of 0.060%), Immigrants from Bangladesh ($39,910, a difference of 0.10%), and Slovene ($39,817, a difference of 0.13%).
| Demographics | Rating | Rank | Median Female Earnings |
| Alsatians | 68.0 /100 | #161 | Good $40,060 |
| South American Indians | 66.1 /100 | #162 | Good $40,019 |
| Lebanese | 65.5 /100 | #163 | Good $40,006 |
| Immigrants | Saudi Arabia | 62.9 /100 | #164 | Good $39,952 |
| Immigrants | Bangladesh | 60.8 /100 | #165 | Good $39,910 |
| Immigrants | Ghana | 60.0 /100 | #166 | Good $39,894 |
| Luxembourgers | 59.9 /100 | #167 | Average $39,891 |
| Immigrants | Peru | 58.9 /100 | #168 | Average $39,871 |
| Kenyans | 58.4 /100 | #169 | Average $39,860 |
| Slovenes | 56.2 /100 | #170 | Average $39,817 |
| Immigrants | Portugal | 54.7 /100 | #171 | Average $39,788 |
| British | 53.8 /100 | #172 | Average $39,772 |
| Canadians | 51.4 /100 | #173 | Average $39,724 |
| South Americans | 50.0 /100 | #174 | Average $39,698 |
| Immigrants | South America | 47.2 /100 | #175 | Average $39,643 |