Luxembourger vs Immigrants from Peru Median Female Earnings
COMPARE
Luxembourger
Immigrants from Peru
Median Female Earnings
Median Female Earnings Comparison
Luxembourgers
Immigrants from Peru
$39,891
MEDIAN FEMALE EARNINGS
59.9/ 100
METRIC RATING
167th/ 347
METRIC RANK
$39,871
MEDIAN FEMALE EARNINGS
58.9/ 100
METRIC RATING
168th/ 347
METRIC RANK
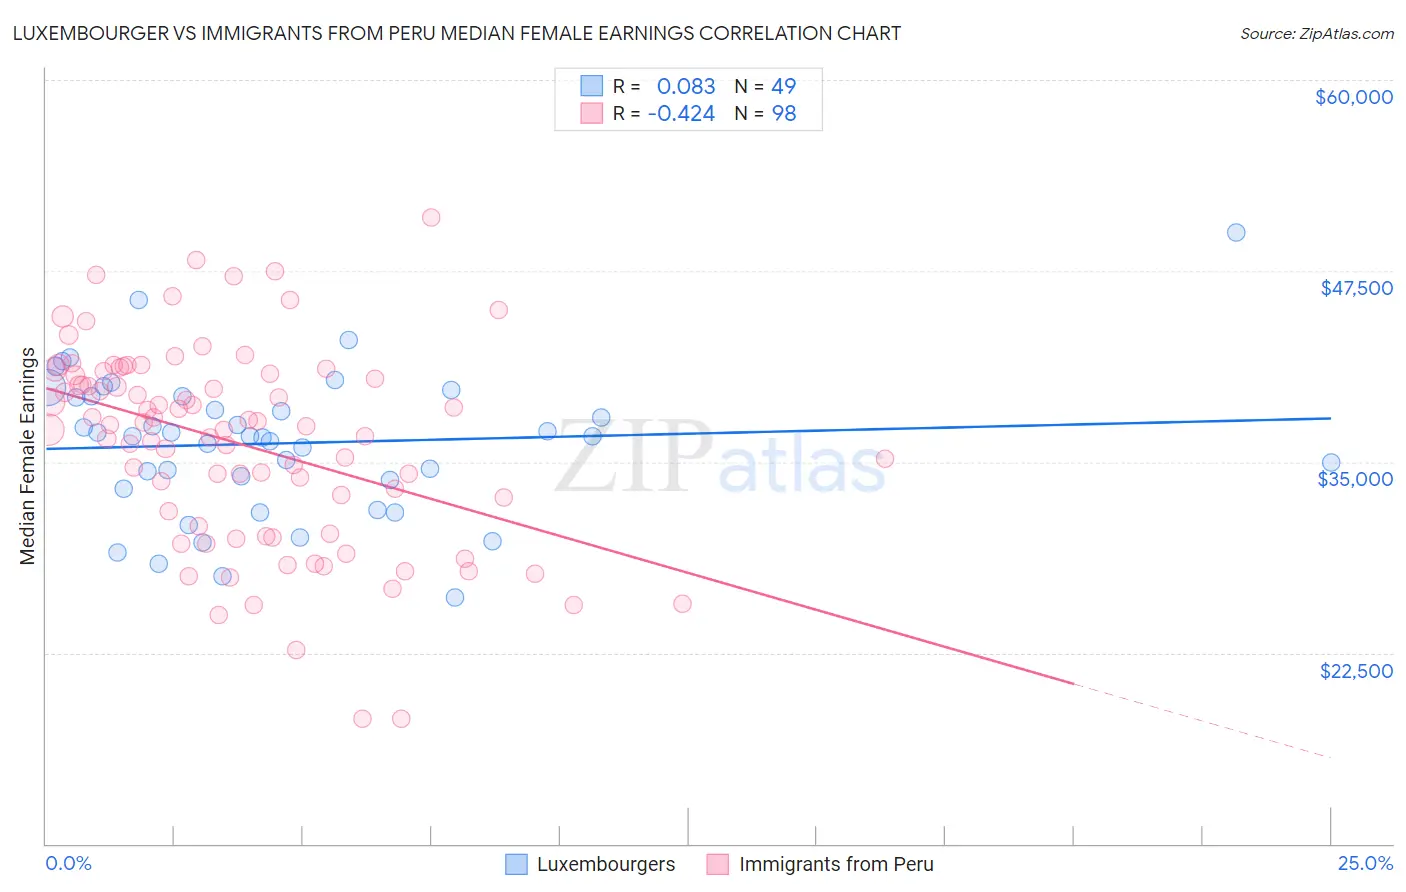
Luxembourger vs Immigrants from Peru Median Female Earnings Correlation Chart
The statistical analysis conducted on geographies consisting of 144,650,946 people shows a slight positive correlation between the proportion of Luxembourgers and median female earnings in the United States with a correlation coefficient (R) of 0.083 and weighted average of $39,891. Similarly, the statistical analysis conducted on geographies consisting of 328,788,415 people shows a moderate negative correlation between the proportion of Immigrants from Peru and median female earnings in the United States with a correlation coefficient (R) of -0.424 and weighted average of $39,871, a difference of 0.050%.
Median Female Earnings Correlation Summary
| Measurement | Luxembourger | Immigrants from Peru |
| Minimum | $26,088 | $18,150 |
| Maximum | $50,000 | $50,975 |
| Range | $23,912 | $32,825 |
| Mean | $36,224 | $36,171 |
| Median | $36,648 | $37,366 |
| Interquartile 25% (IQ1) | $33,540 | $30,816 |
| Interquartile 75% (IQ3) | $39,298 | $40,742 |
| Interquartile Range (IQR) | $5,758 | $9,926 |
| Standard Deviation (Sample) | $4,701 | $6,551 |
| Standard Deviation (Population) | $4,653 | $6,517 |
Demographics Similar to Luxembourgers and Immigrants from Peru by Median Female Earnings
In terms of median female earnings, the demographic groups most similar to Luxembourgers are Immigrants from Ghana ($39,894, a difference of 0.010%), Immigrants from Bangladesh ($39,910, a difference of 0.050%), Kenyan ($39,860, a difference of 0.080%), Immigrants from Saudi Arabia ($39,952, a difference of 0.15%), and Slovene ($39,817, a difference of 0.19%). Similarly, the demographic groups most similar to Immigrants from Peru are Kenyan ($39,860, a difference of 0.030%), Immigrants from Ghana ($39,894, a difference of 0.060%), Immigrants from Bangladesh ($39,910, a difference of 0.10%), Slovene ($39,817, a difference of 0.13%), and Immigrants from Saudi Arabia ($39,952, a difference of 0.20%).
| Demographics | Rating | Rank | Median Female Earnings |
| Portuguese | 73.0 /100 | #157 | Good $40,177 |
| Immigrants | Senegal | 72.2 /100 | #158 | Good $40,157 |
| Immigrants | Vietnam | 72.0 /100 | #159 | Good $40,153 |
| Inupiat | 68.9 /100 | #160 | Good $40,080 |
| Alsatians | 68.0 /100 | #161 | Good $40,060 |
| South American Indians | 66.1 /100 | #162 | Good $40,019 |
| Lebanese | 65.5 /100 | #163 | Good $40,006 |
| Immigrants | Saudi Arabia | 62.9 /100 | #164 | Good $39,952 |
| Immigrants | Bangladesh | 60.8 /100 | #165 | Good $39,910 |
| Immigrants | Ghana | 60.0 /100 | #166 | Good $39,894 |
| Luxembourgers | 59.9 /100 | #167 | Average $39,891 |
| Immigrants | Peru | 58.9 /100 | #168 | Average $39,871 |
| Kenyans | 58.4 /100 | #169 | Average $39,860 |
| Slovenes | 56.2 /100 | #170 | Average $39,817 |
| Immigrants | Portugal | 54.7 /100 | #171 | Average $39,788 |
| British | 53.8 /100 | #172 | Average $39,772 |
| Canadians | 51.4 /100 | #173 | Average $39,724 |
| South Americans | 50.0 /100 | #174 | Average $39,698 |
| Immigrants | South America | 47.2 /100 | #175 | Average $39,643 |
| Nigerians | 47.0 /100 | #176 | Average $39,641 |
| Costa Ricans | 46.1 /100 | #177 | Average $39,622 |