Ukrainian vs Italian Per Capita Income
COMPARE
Ukrainian
Italian
Per Capita Income
Per Capita Income Comparison
Ukrainians
Italians
$48,014
PER CAPITA INCOME
99.3/ 100
METRIC RATING
87th/ 347
METRIC RANK
$47,574
PER CAPITA INCOME
98.8/ 100
METRIC RATING
90th/ 347
METRIC RANK
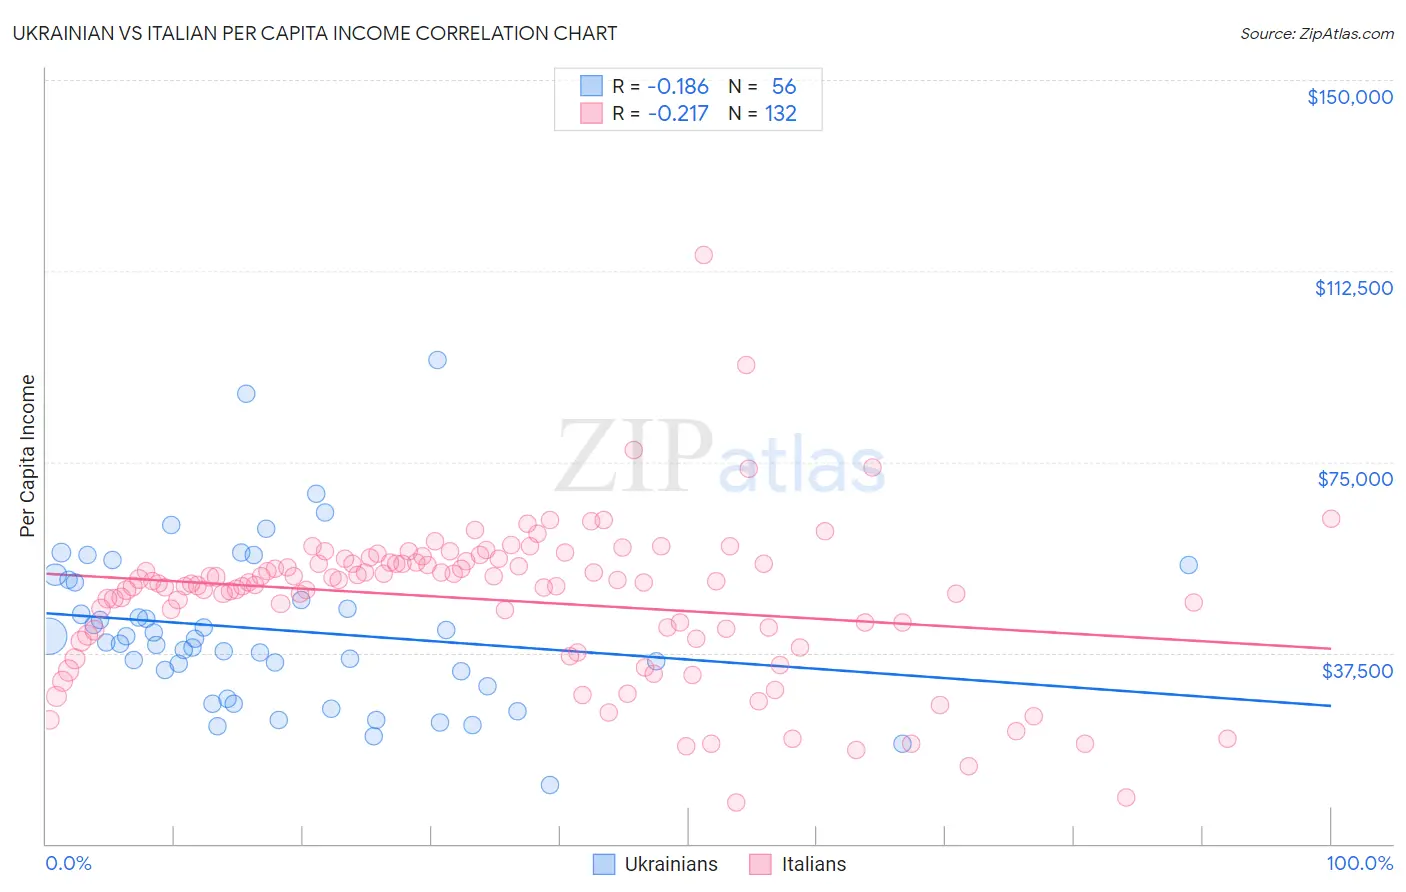
Ukrainian vs Italian Per Capita Income Correlation Chart
The statistical analysis conducted on geographies consisting of 448,721,179 people shows a poor negative correlation between the proportion of Ukrainians and per capita income in the United States with a correlation coefficient (R) of -0.186 and weighted average of $48,014. Similarly, the statistical analysis conducted on geographies consisting of 575,176,397 people shows a weak negative correlation between the proportion of Italians and per capita income in the United States with a correlation coefficient (R) of -0.217 and weighted average of $47,574, a difference of 0.92%.
Per Capita Income Correlation Summary
| Measurement | Ukrainian | Italian |
| Minimum | $11,586 | $7,984 |
| Maximum | $95,117 | $115,662 |
| Range | $83,531 | $107,678 |
| Mean | $42,023 | $47,928 |
| Median | $39,896 | $51,120 |
| Interquartile 25% (IQ1) | $32,403 | $41,399 |
| Interquartile 75% (IQ3) | $51,527 | $55,329 |
| Interquartile Range (IQR) | $19,124 | $13,930 |
| Standard Deviation (Sample) | $15,846 | $15,071 |
| Standard Deviation (Population) | $15,703 | $15,014 |
Demographics Similar to Ukrainians and Italians by Per Capita Income
In terms of per capita income, the demographic groups most similar to Ukrainians are Immigrants from Southern Europe ($48,027, a difference of 0.030%), Austrian ($48,116, a difference of 0.21%), Immigrants from Ukraine ($48,134, a difference of 0.25%), Immigrants from Brazil ($48,164, a difference of 0.31%), and Immigrants from Indonesia ($48,195, a difference of 0.38%). Similarly, the demographic groups most similar to Italians are Macedonian ($47,573, a difference of 0.0%), Immigrants from Moldova ($47,489, a difference of 0.18%), Northern European ($47,698, a difference of 0.26%), Croatian ($47,742, a difference of 0.35%), and Immigrants from Zimbabwe ($47,394, a difference of 0.38%).
| Demographics | Rating | Rank | Per Capita Income |
| Immigrants | Italy | 99.6 /100 | #78 | Exceptional $48,654 |
| Romanians | 99.5 /100 | #79 | Exceptional $48,445 |
| Egyptians | 99.5 /100 | #80 | Exceptional $48,358 |
| Armenians | 99.4 /100 | #81 | Exceptional $48,287 |
| Immigrants | Indonesia | 99.4 /100 | #82 | Exceptional $48,195 |
| Immigrants | Brazil | 99.4 /100 | #83 | Exceptional $48,164 |
| Immigrants | Ukraine | 99.3 /100 | #84 | Exceptional $48,134 |
| Austrians | 99.3 /100 | #85 | Exceptional $48,116 |
| Immigrants | Southern Europe | 99.3 /100 | #86 | Exceptional $48,027 |
| Ukrainians | 99.3 /100 | #87 | Exceptional $48,014 |
| Croatians | 99.0 /100 | #88 | Exceptional $47,742 |
| Northern Europeans | 98.9 /100 | #89 | Exceptional $47,698 |
| Italians | 98.8 /100 | #90 | Exceptional $47,574 |
| Macedonians | 98.8 /100 | #91 | Exceptional $47,573 |
| Immigrants | Moldova | 98.7 /100 | #92 | Exceptional $47,489 |
| Immigrants | Zimbabwe | 98.5 /100 | #93 | Exceptional $47,394 |
| Albanians | 98.5 /100 | #94 | Exceptional $47,379 |
| Immigrants | Egypt | 98.5 /100 | #95 | Exceptional $47,361 |
| Alsatians | 98.3 /100 | #96 | Exceptional $47,284 |
| Carpatho Rusyns | 98.2 /100 | #97 | Exceptional $47,248 |
| Immigrants | Pakistan | 97.9 /100 | #98 | Exceptional $47,084 |