Immigrants from Sri Lanka vs Italian Per Capita Income
COMPARE
Immigrants from Sri Lanka
Italian
Per Capita Income
Per Capita Income Comparison
Immigrants from Sri Lanka
Italians
$50,555
PER CAPITA INCOME
100.0/ 100
METRIC RATING
50th/ 347
METRIC RANK
$47,574
PER CAPITA INCOME
98.8/ 100
METRIC RATING
90th/ 347
METRIC RANK
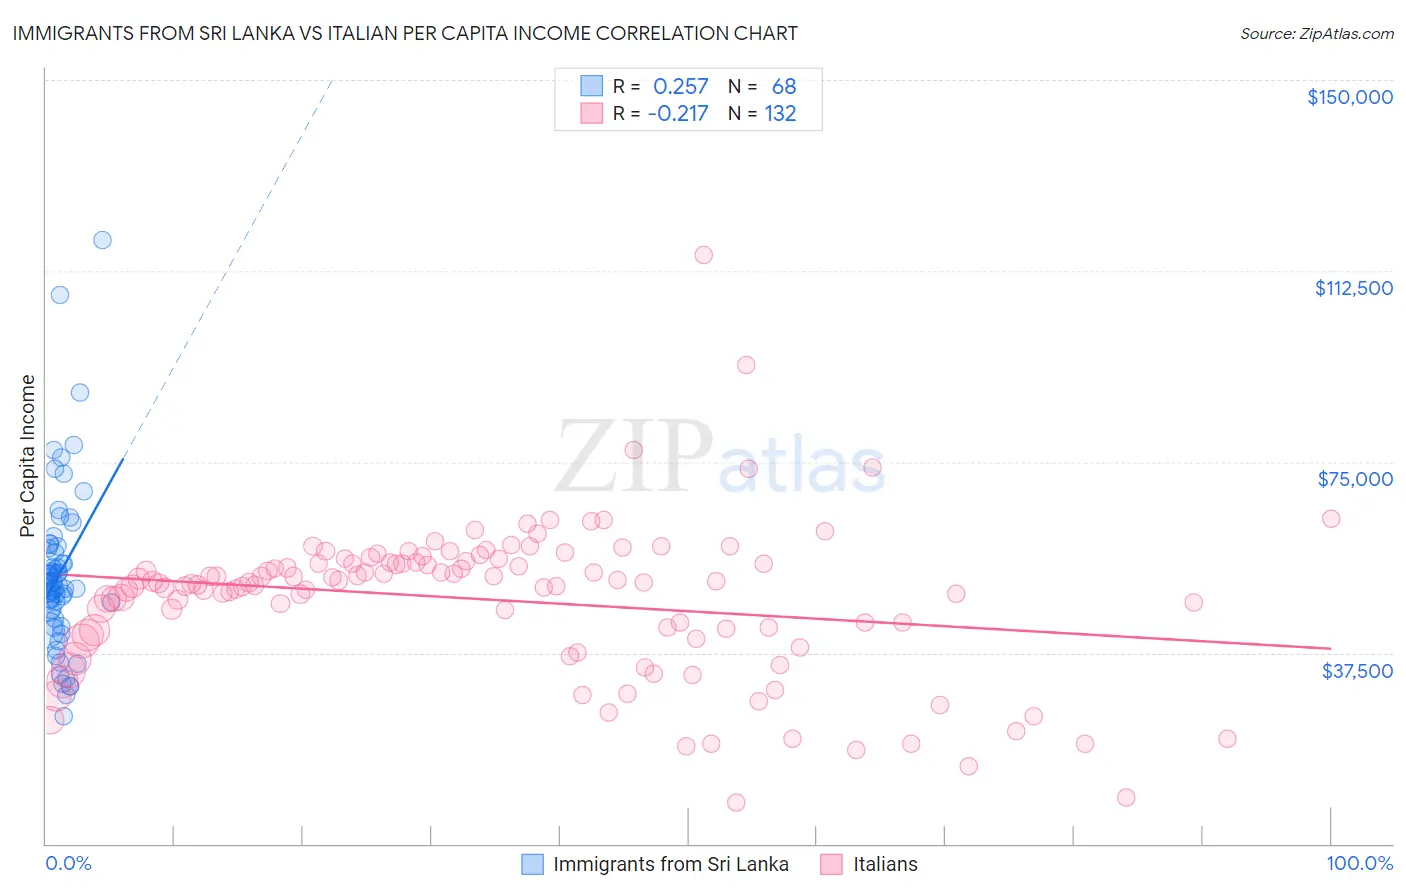
Immigrants from Sri Lanka vs Italian Per Capita Income Correlation Chart
The statistical analysis conducted on geographies consisting of 149,699,244 people shows a weak positive correlation between the proportion of Immigrants from Sri Lanka and per capita income in the United States with a correlation coefficient (R) of 0.257 and weighted average of $50,555. Similarly, the statistical analysis conducted on geographies consisting of 575,176,397 people shows a weak negative correlation between the proportion of Italians and per capita income in the United States with a correlation coefficient (R) of -0.217 and weighted average of $47,574, a difference of 6.3%.
Per Capita Income Correlation Summary
| Measurement | Immigrants from Sri Lanka | Italian |
| Minimum | $24,946 | $7,984 |
| Maximum | $118,591 | $115,662 |
| Range | $93,645 | $107,678 |
| Mean | $53,052 | $47,928 |
| Median | $50,889 | $51,120 |
| Interquartile 25% (IQ1) | $45,023 | $41,399 |
| Interquartile 75% (IQ3) | $58,187 | $55,329 |
| Interquartile Range (IQR) | $13,164 | $13,930 |
| Standard Deviation (Sample) | $16,356 | $15,071 |
| Standard Deviation (Population) | $16,236 | $15,014 |
Similar Demographics by Per Capita Income
Demographics Similar to Immigrants from Sri Lanka by Per Capita Income
In terms of per capita income, the demographic groups most similar to Immigrants from Sri Lanka are New Zealander ($50,575, a difference of 0.040%), Immigrants from Netherlands ($50,458, a difference of 0.19%), Immigrants from Croatia ($50,417, a difference of 0.27%), Paraguayan ($50,385, a difference of 0.34%), and Immigrants from Serbia ($50,810, a difference of 0.50%).
| Demographics | Rating | Rank | Per Capita Income |
| Immigrants | Lithuania | 100.0 /100 | #43 | Exceptional $51,361 |
| Immigrants | Europe | 100.0 /100 | #44 | Exceptional $50,950 |
| Immigrants | Spain | 100.0 /100 | #45 | Exceptional $50,933 |
| Immigrants | Latvia | 100.0 /100 | #46 | Exceptional $50,914 |
| Bulgarians | 100.0 /100 | #47 | Exceptional $50,906 |
| Immigrants | Serbia | 100.0 /100 | #48 | Exceptional $50,810 |
| New Zealanders | 100.0 /100 | #49 | Exceptional $50,575 |
| Immigrants | Sri Lanka | 100.0 /100 | #50 | Exceptional $50,555 |
| Immigrants | Netherlands | 100.0 /100 | #51 | Exceptional $50,458 |
| Immigrants | Croatia | 99.9 /100 | #52 | Exceptional $50,417 |
| Paraguayans | 99.9 /100 | #53 | Exceptional $50,385 |
| Immigrants | Belarus | 99.9 /100 | #54 | Exceptional $50,303 |
| Immigrants | Western Europe | 99.9 /100 | #55 | Exceptional $50,065 |
| Asians | 99.9 /100 | #56 | Exceptional $50,057 |
| South Africans | 99.9 /100 | #57 | Exceptional $50,044 |
Demographics Similar to Italians by Per Capita Income
In terms of per capita income, the demographic groups most similar to Italians are Macedonian ($47,573, a difference of 0.0%), Immigrants from Moldova ($47,489, a difference of 0.18%), Northern European ($47,698, a difference of 0.26%), Croatian ($47,742, a difference of 0.35%), and Immigrants from Zimbabwe ($47,394, a difference of 0.38%).
| Demographics | Rating | Rank | Per Capita Income |
| Immigrants | Brazil | 99.4 /100 | #83 | Exceptional $48,164 |
| Immigrants | Ukraine | 99.3 /100 | #84 | Exceptional $48,134 |
| Austrians | 99.3 /100 | #85 | Exceptional $48,116 |
| Immigrants | Southern Europe | 99.3 /100 | #86 | Exceptional $48,027 |
| Ukrainians | 99.3 /100 | #87 | Exceptional $48,014 |
| Croatians | 99.0 /100 | #88 | Exceptional $47,742 |
| Northern Europeans | 98.9 /100 | #89 | Exceptional $47,698 |
| Italians | 98.8 /100 | #90 | Exceptional $47,574 |
| Macedonians | 98.8 /100 | #91 | Exceptional $47,573 |
| Immigrants | Moldova | 98.7 /100 | #92 | Exceptional $47,489 |
| Immigrants | Zimbabwe | 98.5 /100 | #93 | Exceptional $47,394 |
| Albanians | 98.5 /100 | #94 | Exceptional $47,379 |
| Immigrants | Egypt | 98.5 /100 | #95 | Exceptional $47,361 |
| Alsatians | 98.3 /100 | #96 | Exceptional $47,284 |
| Carpatho Rusyns | 98.2 /100 | #97 | Exceptional $47,248 |