Inupiat vs Immigrants from Belize Median Household Income
COMPARE
Inupiat
Immigrants from Belize
Median Household Income
Median Household Income Comparison
Inupiat
Immigrants from Belize
$78,841
MEDIAN HOUSEHOLD INCOME
1.8/ 100
METRIC RATING
245th/ 347
METRIC RANK
$75,938
MEDIAN HOUSEHOLD INCOME
0.3/ 100
METRIC RATING
265th/ 347
METRIC RANK
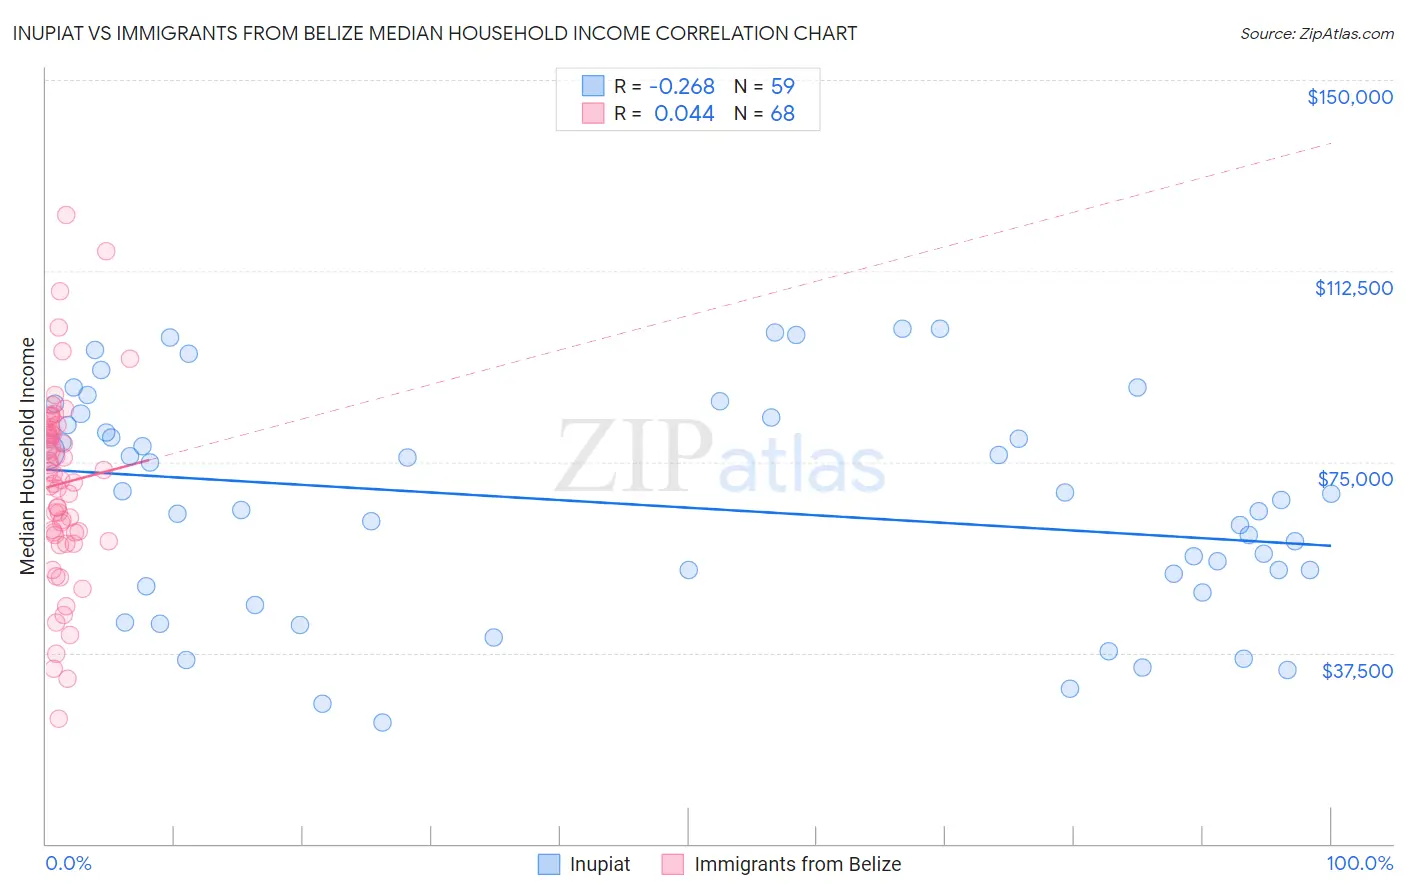
Inupiat vs Immigrants from Belize Median Household Income Correlation Chart
The statistical analysis conducted on geographies consisting of 96,314,941 people shows a weak negative correlation between the proportion of Inupiat and median household income in the United States with a correlation coefficient (R) of -0.268 and weighted average of $78,841. Similarly, the statistical analysis conducted on geographies consisting of 130,279,222 people shows no correlation between the proportion of Immigrants from Belize and median household income in the United States with a correlation coefficient (R) of 0.044 and weighted average of $75,938, a difference of 3.8%.
Median Household Income Correlation Summary
| Measurement | Inupiat | Immigrants from Belize |
| Minimum | $23,889 | $24,491 |
| Maximum | $101,071 | $123,457 |
| Range | $77,182 | $98,966 |
| Mean | $66,659 | $70,734 |
| Median | $67,500 | $72,073 |
| Interquartile 25% (IQ1) | $50,572 | $60,781 |
| Interquartile 75% (IQ3) | $83,750 | $80,909 |
| Interquartile Range (IQR) | $33,178 | $20,129 |
| Standard Deviation (Sample) | $21,353 | $18,493 |
| Standard Deviation (Population) | $21,171 | $18,357 |
Demographics Similar to Inupiat and Immigrants from Belize by Median Household Income
In terms of median household income, the demographic groups most similar to Inupiat are Central American ($78,803, a difference of 0.050%), Immigrants from Burma/Myanmar ($78,682, a difference of 0.20%), Sudanese ($78,529, a difference of 0.40%), West Indian ($78,455, a difference of 0.49%), and Immigrants from Laos ($78,327, a difference of 0.66%). Similarly, the demographic groups most similar to Immigrants from Belize are Guatemalan ($75,961, a difference of 0.030%), French American Indian ($76,387, a difference of 0.59%), Alaskan Athabascan ($76,383, a difference of 0.59%), Immigrants from Grenada ($76,517, a difference of 0.76%), and Jamaican ($76,583, a difference of 0.85%).
| Demographics | Rating | Rank | Median Household Income |
| Inupiat | 1.8 /100 | #245 | Tragic $78,841 |
| Central Americans | 1.7 /100 | #246 | Tragic $78,803 |
| Immigrants | Burma/Myanmar | 1.6 /100 | #247 | Tragic $78,682 |
| Sudanese | 1.5 /100 | #248 | Tragic $78,529 |
| West Indians | 1.4 /100 | #249 | Tragic $78,455 |
| Immigrants | Laos | 1.3 /100 | #250 | Tragic $78,327 |
| Mexican American Indians | 1.2 /100 | #251 | Tragic $78,166 |
| Immigrants | West Indies | 1.0 /100 | #252 | Tragic $77,956 |
| Immigrants | St. Vincent and the Grenadines | 0.9 /100 | #253 | Tragic $77,690 |
| Sub-Saharan Africans | 0.8 /100 | #254 | Tragic $77,631 |
| Immigrants | Middle Africa | 0.8 /100 | #255 | Tragic $77,559 |
| Belizeans | 0.6 /100 | #256 | Tragic $77,028 |
| Immigrants | Senegal | 0.5 /100 | #257 | Tragic $76,915 |
| Immigrants | Nicaragua | 0.5 /100 | #258 | Tragic $76,784 |
| Spanish American Indians | 0.4 /100 | #259 | Tragic $76,670 |
| Jamaicans | 0.4 /100 | #260 | Tragic $76,583 |
| Immigrants | Grenada | 0.4 /100 | #261 | Tragic $76,517 |
| French American Indians | 0.4 /100 | #262 | Tragic $76,387 |
| Alaskan Athabascans | 0.4 /100 | #263 | Tragic $76,383 |
| Guatemalans | 0.3 /100 | #264 | Tragic $75,961 |
| Immigrants | Belize | 0.3 /100 | #265 | Tragic $75,938 |