Inupiat vs Immigrants from Zimbabwe Median Family Income
COMPARE
Inupiat
Immigrants from Zimbabwe
Median Family Income
Median Family Income Comparison
Inupiat
Immigrants from Zimbabwe
$91,730
MEDIAN FAMILY INCOME
0.4/ 100
METRIC RATING
261st/ 347
METRIC RANK
$108,830
MEDIAN FAMILY INCOME
95.9/ 100
METRIC RATING
108th/ 347
METRIC RANK
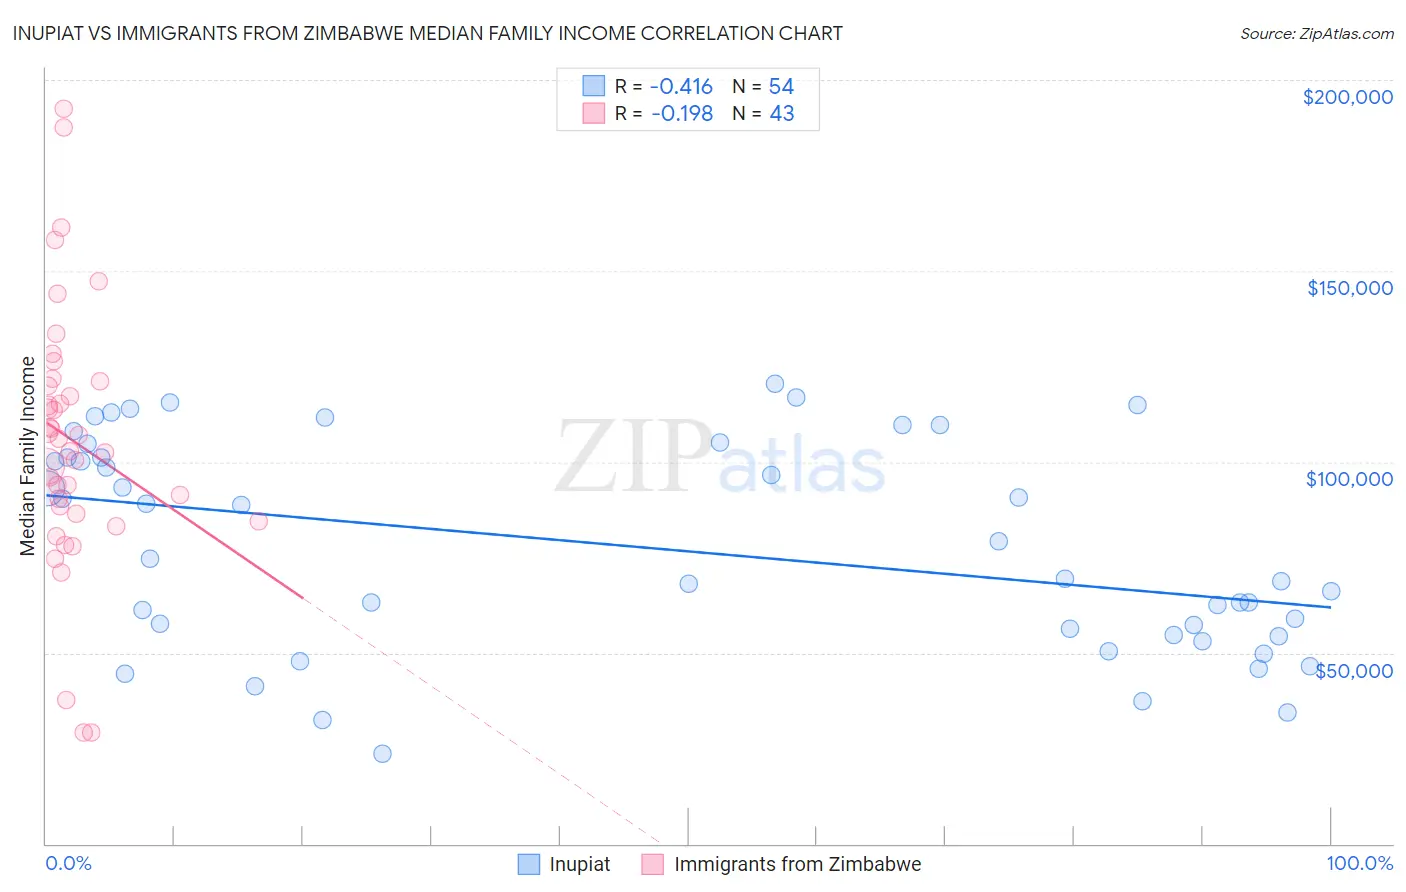
Inupiat vs Immigrants from Zimbabwe Median Family Income Correlation Chart
The statistical analysis conducted on geographies consisting of 96,309,592 people shows a moderate negative correlation between the proportion of Inupiat and median family income in the United States with a correlation coefficient (R) of -0.416 and weighted average of $91,730. Similarly, the statistical analysis conducted on geographies consisting of 117,781,123 people shows a poor negative correlation between the proportion of Immigrants from Zimbabwe and median family income in the United States with a correlation coefficient (R) of -0.198 and weighted average of $108,830, a difference of 18.6%.
Median Family Income Correlation Summary
| Measurement | Inupiat | Immigrants from Zimbabwe |
| Minimum | $23,690 | $29,063 |
| Maximum | $120,501 | $192,404 |
| Range | $96,811 | $163,341 |
| Mean | $77,500 | $105,675 |
| Median | $72,103 | $105,969 |
| Interquartile 25% (IQ1) | $54,583 | $86,427 |
| Interquartile 75% (IQ3) | $101,242 | $121,096 |
| Interquartile Range (IQR) | $46,659 | $34,669 |
| Standard Deviation (Sample) | $27,340 | $34,287 |
| Standard Deviation (Population) | $27,086 | $33,886 |
Similar Demographics by Median Family Income
Demographics Similar to Inupiat by Median Family Income
In terms of median family income, the demographic groups most similar to Inupiat are Liberian ($91,722, a difference of 0.010%), Pennsylvania German ($91,763, a difference of 0.040%), Cape Verdean ($91,848, a difference of 0.13%), Immigrants from West Indies ($91,588, a difference of 0.16%), and Osage ($91,926, a difference of 0.21%).
| Demographics | Rating | Rank | Median Family Income |
| Immigrants | Barbados | 0.5 /100 | #254 | Tragic $92,419 |
| Immigrants | Laos | 0.5 /100 | #255 | Tragic $92,239 |
| Nicaraguans | 0.5 /100 | #256 | Tragic $92,231 |
| Americans | 0.4 /100 | #257 | Tragic $92,096 |
| Osage | 0.4 /100 | #258 | Tragic $91,926 |
| Cape Verdeans | 0.4 /100 | #259 | Tragic $91,848 |
| Pennsylvania Germans | 0.4 /100 | #260 | Tragic $91,763 |
| Inupiat | 0.4 /100 | #261 | Tragic $91,730 |
| Liberians | 0.4 /100 | #262 | Tragic $91,722 |
| Immigrants | West Indies | 0.3 /100 | #263 | Tragic $91,588 |
| Senegalese | 0.3 /100 | #264 | Tragic $91,475 |
| Hmong | 0.3 /100 | #265 | Tragic $91,296 |
| Central Americans | 0.3 /100 | #266 | Tragic $91,087 |
| Mexican American Indians | 0.2 /100 | #267 | Tragic $90,918 |
| Cree | 0.2 /100 | #268 | Tragic $90,882 |
Demographics Similar to Immigrants from Zimbabwe by Median Family Income
In terms of median family income, the demographic groups most similar to Immigrants from Zimbabwe are Immigrants from Afghanistan ($108,709, a difference of 0.11%), British ($108,705, a difference of 0.12%), Immigrants from Western Asia ($108,691, a difference of 0.13%), Immigrants from Poland ($108,570, a difference of 0.24%), and Immigrants from Saudi Arabia ($108,544, a difference of 0.26%).
| Demographics | Rating | Rank | Median Family Income |
| Immigrants | Ukraine | 97.2 /100 | #101 | Exceptional $109,645 |
| Assyrians/Chaldeans/Syriacs | 97.2 /100 | #102 | Exceptional $109,622 |
| Immigrants | Brazil | 96.9 /100 | #103 | Exceptional $109,418 |
| Palestinians | 96.9 /100 | #104 | Exceptional $109,413 |
| Syrians | 96.7 /100 | #105 | Exceptional $109,299 |
| Albanians | 96.4 /100 | #106 | Exceptional $109,136 |
| Immigrants | North Macedonia | 96.4 /100 | #107 | Exceptional $109,136 |
| Immigrants | Zimbabwe | 95.9 /100 | #108 | Exceptional $108,830 |
| Immigrants | Afghanistan | 95.6 /100 | #109 | Exceptional $108,709 |
| British | 95.6 /100 | #110 | Exceptional $108,705 |
| Immigrants | Western Asia | 95.6 /100 | #111 | Exceptional $108,691 |
| Immigrants | Poland | 95.3 /100 | #112 | Exceptional $108,570 |
| Immigrants | Saudi Arabia | 95.2 /100 | #113 | Exceptional $108,544 |
| Poles | 95.2 /100 | #114 | Exceptional $108,507 |
| Swedes | 95.1 /100 | #115 | Exceptional $108,499 |