Inupiat vs Filipino Median Family Income
COMPARE
Inupiat
Filipino
Median Family Income
Median Family Income Comparison
Inupiat
Filipinos
$91,730
MEDIAN FAMILY INCOME
0.4/ 100
METRIC RATING
261st/ 347
METRIC RANK
$138,397
MEDIAN FAMILY INCOME
100.0/ 100
METRIC RATING
1st/ 347
METRIC RANK
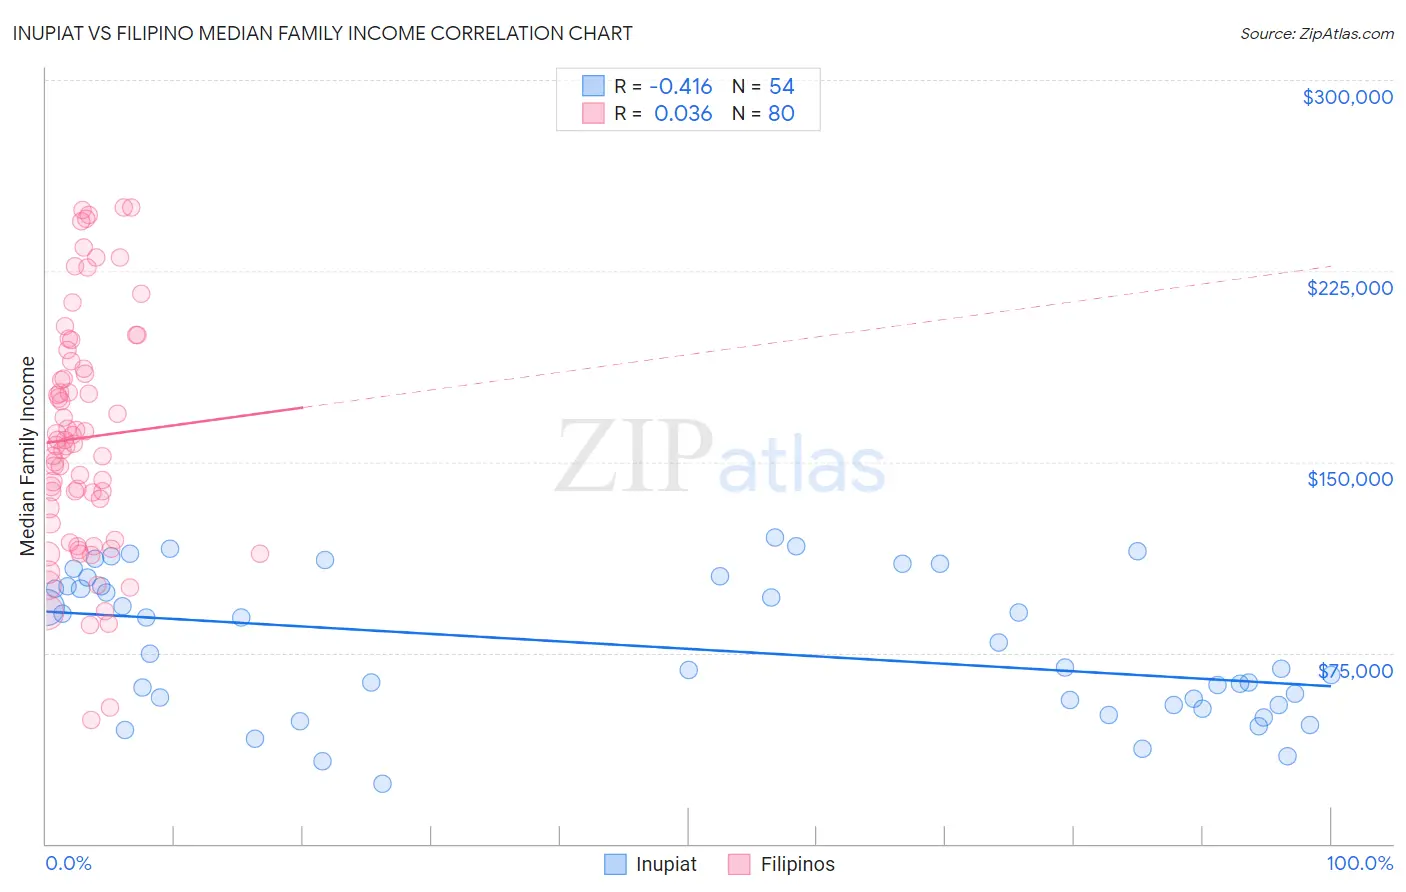
Inupiat vs Filipino Median Family Income Correlation Chart
The statistical analysis conducted on geographies consisting of 96,309,592 people shows a moderate negative correlation between the proportion of Inupiat and median family income in the United States with a correlation coefficient (R) of -0.416 and weighted average of $91,730. Similarly, the statistical analysis conducted on geographies consisting of 254,105,404 people shows no correlation between the proportion of Filipinos and median family income in the United States with a correlation coefficient (R) of 0.036 and weighted average of $138,397, a difference of 50.9%.
Median Family Income Correlation Summary
| Measurement | Inupiat | Filipino |
| Minimum | $23,690 | $48,393 |
| Maximum | $120,501 | $250,001 |
| Range | $96,811 | $201,608 |
| Mean | $77,500 | $159,472 |
| Median | $72,103 | $156,854 |
| Interquartile 25% (IQ1) | $54,583 | $122,608 |
| Interquartile 75% (IQ3) | $101,242 | $188,025 |
| Interquartile Range (IQR) | $46,659 | $65,417 |
| Standard Deviation (Sample) | $27,340 | $46,927 |
| Standard Deviation (Population) | $27,086 | $46,633 |
Similar Demographics by Median Family Income
Demographics Similar to Inupiat by Median Family Income
In terms of median family income, the demographic groups most similar to Inupiat are Liberian ($91,722, a difference of 0.010%), Pennsylvania German ($91,763, a difference of 0.040%), Cape Verdean ($91,848, a difference of 0.13%), Immigrants from West Indies ($91,588, a difference of 0.16%), and Osage ($91,926, a difference of 0.21%).
| Demographics | Rating | Rank | Median Family Income |
| Immigrants | Barbados | 0.5 /100 | #254 | Tragic $92,419 |
| Immigrants | Laos | 0.5 /100 | #255 | Tragic $92,239 |
| Nicaraguans | 0.5 /100 | #256 | Tragic $92,231 |
| Americans | 0.4 /100 | #257 | Tragic $92,096 |
| Osage | 0.4 /100 | #258 | Tragic $91,926 |
| Cape Verdeans | 0.4 /100 | #259 | Tragic $91,848 |
| Pennsylvania Germans | 0.4 /100 | #260 | Tragic $91,763 |
| Inupiat | 0.4 /100 | #261 | Tragic $91,730 |
| Liberians | 0.4 /100 | #262 | Tragic $91,722 |
| Immigrants | West Indies | 0.3 /100 | #263 | Tragic $91,588 |
| Senegalese | 0.3 /100 | #264 | Tragic $91,475 |
| Hmong | 0.3 /100 | #265 | Tragic $91,296 |
| Central Americans | 0.3 /100 | #266 | Tragic $91,087 |
| Mexican American Indians | 0.2 /100 | #267 | Tragic $90,918 |
| Cree | 0.2 /100 | #268 | Tragic $90,882 |
Demographics Similar to Filipinos by Median Family Income
In terms of median family income, the demographic groups most similar to Filipinos are Immigrants from Taiwan ($136,949, a difference of 1.1%), Immigrants from Singapore ($134,818, a difference of 2.6%), Immigrants from India ($134,028, a difference of 3.3%), Iranian ($133,839, a difference of 3.4%), and Thai ($131,281, a difference of 5.4%).
| Demographics | Rating | Rank | Median Family Income |
| Filipinos | 100.0 /100 | #1 | Exceptional $138,397 |
| Immigrants | Taiwan | 100.0 /100 | #2 | Exceptional $136,949 |
| Immigrants | Singapore | 100.0 /100 | #3 | Exceptional $134,818 |
| Immigrants | India | 100.0 /100 | #4 | Exceptional $134,028 |
| Iranians | 100.0 /100 | #5 | Exceptional $133,839 |
| Thais | 100.0 /100 | #6 | Exceptional $131,281 |
| Immigrants | Hong Kong | 100.0 /100 | #7 | Exceptional $131,067 |
| Immigrants | Iran | 100.0 /100 | #8 | Exceptional $130,894 |
| Okinawans | 100.0 /100 | #9 | Exceptional $129,979 |
| Immigrants | Ireland | 100.0 /100 | #10 | Exceptional $127,584 |
| Immigrants | Israel | 100.0 /100 | #11 | Exceptional $127,430 |
| Cypriots | 100.0 /100 | #12 | Exceptional $127,064 |
| Immigrants | Australia | 100.0 /100 | #13 | Exceptional $126,620 |
| Immigrants | South Central Asia | 100.0 /100 | #14 | Exceptional $125,956 |
| Eastern Europeans | 100.0 /100 | #15 | Exceptional $125,546 |