Inupiat vs Immigrants from South America Median Family Income
COMPARE
Inupiat
Immigrants from South America
Median Family Income
Median Family Income Comparison
Inupiat
Immigrants from South America
$91,730
MEDIAN FAMILY INCOME
0.4/ 100
METRIC RATING
261st/ 347
METRIC RANK
$100,414
MEDIAN FAMILY INCOME
23.9/ 100
METRIC RATING
195th/ 347
METRIC RANK
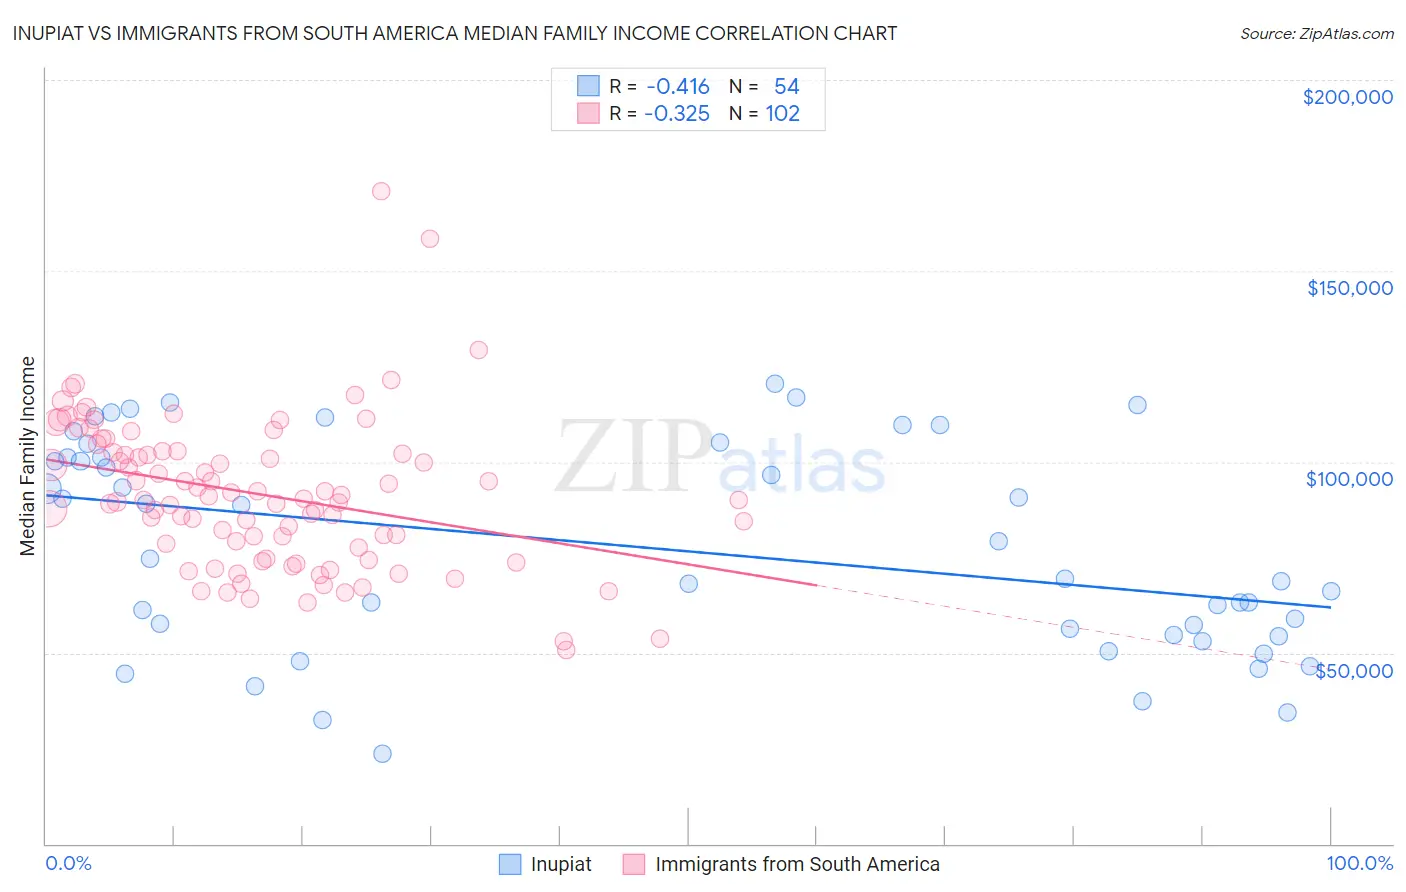
Inupiat vs Immigrants from South America Median Family Income Correlation Chart
The statistical analysis conducted on geographies consisting of 96,309,592 people shows a moderate negative correlation between the proportion of Inupiat and median family income in the United States with a correlation coefficient (R) of -0.416 and weighted average of $91,730. Similarly, the statistical analysis conducted on geographies consisting of 485,794,963 people shows a mild negative correlation between the proportion of Immigrants from South America and median family income in the United States with a correlation coefficient (R) of -0.325 and weighted average of $100,414, a difference of 9.5%.
Median Family Income Correlation Summary
| Measurement | Inupiat | Immigrants from South America |
| Minimum | $23,690 | $50,833 |
| Maximum | $120,501 | $170,845 |
| Range | $96,811 | $120,012 |
| Mean | $77,500 | $91,529 |
| Median | $72,103 | $90,163 |
| Interquartile 25% (IQ1) | $54,583 | $77,453 |
| Interquartile 75% (IQ3) | $101,242 | $102,677 |
| Interquartile Range (IQR) | $46,659 | $25,224 |
| Standard Deviation (Sample) | $27,340 | $19,800 |
| Standard Deviation (Population) | $27,086 | $19,702 |
Similar Demographics by Median Family Income
Demographics Similar to Inupiat by Median Family Income
In terms of median family income, the demographic groups most similar to Inupiat are Liberian ($91,722, a difference of 0.010%), Pennsylvania German ($91,763, a difference of 0.040%), Cape Verdean ($91,848, a difference of 0.13%), Immigrants from West Indies ($91,588, a difference of 0.16%), and Osage ($91,926, a difference of 0.21%).
| Demographics | Rating | Rank | Median Family Income |
| Immigrants | Barbados | 0.5 /100 | #254 | Tragic $92,419 |
| Immigrants | Laos | 0.5 /100 | #255 | Tragic $92,239 |
| Nicaraguans | 0.5 /100 | #256 | Tragic $92,231 |
| Americans | 0.4 /100 | #257 | Tragic $92,096 |
| Osage | 0.4 /100 | #258 | Tragic $91,926 |
| Cape Verdeans | 0.4 /100 | #259 | Tragic $91,848 |
| Pennsylvania Germans | 0.4 /100 | #260 | Tragic $91,763 |
| Inupiat | 0.4 /100 | #261 | Tragic $91,730 |
| Liberians | 0.4 /100 | #262 | Tragic $91,722 |
| Immigrants | West Indies | 0.3 /100 | #263 | Tragic $91,588 |
| Senegalese | 0.3 /100 | #264 | Tragic $91,475 |
| Hmong | 0.3 /100 | #265 | Tragic $91,296 |
| Central Americans | 0.3 /100 | #266 | Tragic $91,087 |
| Mexican American Indians | 0.2 /100 | #267 | Tragic $90,918 |
| Cree | 0.2 /100 | #268 | Tragic $90,882 |
Demographics Similar to Immigrants from South America by Median Family Income
In terms of median family income, the demographic groups most similar to Immigrants from South America are Samoan ($100,344, a difference of 0.070%), Immigrants from Cameroon ($100,289, a difference of 0.12%), Immigrants from Africa ($100,256, a difference of 0.16%), Iraqi ($100,658, a difference of 0.24%), and Uruguayan ($100,656, a difference of 0.24%).
| Demographics | Rating | Rank | Median Family Income |
| Guamanians/Chamorros | 30.5 /100 | #188 | Fair $101,061 |
| Immigrants | Portugal | 29.6 /100 | #189 | Fair $100,984 |
| Immigrants | Immigrants | 29.4 /100 | #190 | Fair $100,962 |
| Colombians | 27.2 /100 | #191 | Fair $100,750 |
| Immigrants | Kenya | 26.5 /100 | #192 | Fair $100,679 |
| Iraqis | 26.3 /100 | #193 | Fair $100,658 |
| Uruguayans | 26.3 /100 | #194 | Fair $100,656 |
| Immigrants | South America | 23.9 /100 | #195 | Fair $100,414 |
| Samoans | 23.3 /100 | #196 | Fair $100,344 |
| Immigrants | Cameroon | 22.8 /100 | #197 | Fair $100,289 |
| Immigrants | Africa | 22.5 /100 | #198 | Fair $100,256 |
| Yugoslavians | 21.3 /100 | #199 | Fair $100,119 |
| Spanish | 20.1 /100 | #200 | Fair $99,977 |
| Immigrants | Thailand | 19.0 /100 | #201 | Poor $99,840 |
| Whites/Caucasians | 18.7 /100 | #202 | Poor $99,800 |