Inupiat vs Pima Median Family Income
COMPARE
Inupiat
Pima
Median Family Income
Median Family Income Comparison
Inupiat
Pima
$91,730
MEDIAN FAMILY INCOME
0.4/ 100
METRIC RATING
261st/ 347
METRIC RANK
$77,431
MEDIAN FAMILY INCOME
0.0/ 100
METRIC RATING
339th/ 347
METRIC RANK
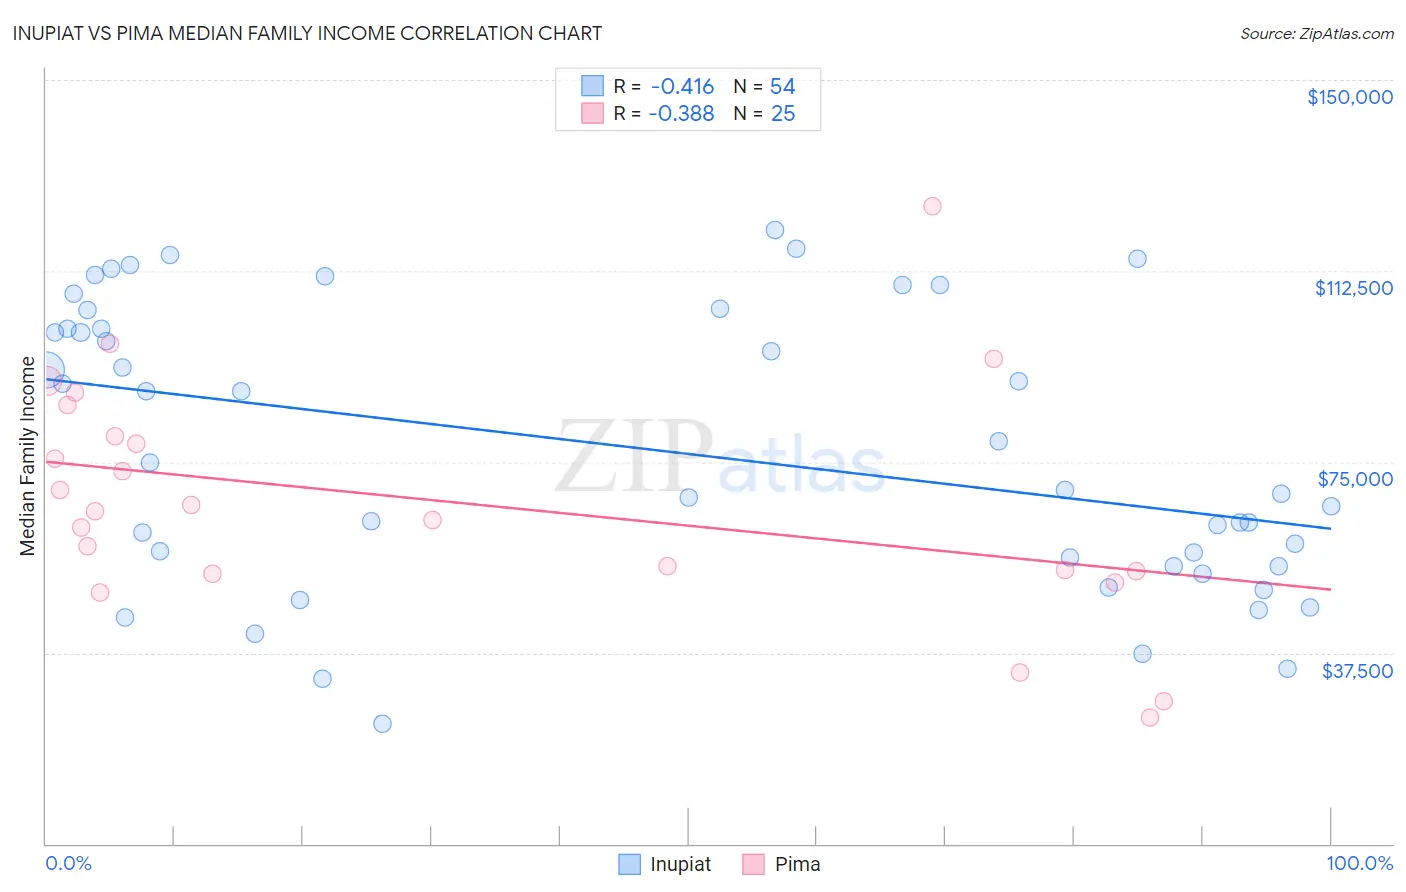
Inupiat vs Pima Median Family Income Correlation Chart
The statistical analysis conducted on geographies consisting of 96,309,592 people shows a moderate negative correlation between the proportion of Inupiat and median family income in the United States with a correlation coefficient (R) of -0.416 and weighted average of $91,730. Similarly, the statistical analysis conducted on geographies consisting of 61,529,758 people shows a mild negative correlation between the proportion of Pima and median family income in the United States with a correlation coefficient (R) of -0.388 and weighted average of $77,431, a difference of 18.5%.
Median Family Income Correlation Summary
| Measurement | Inupiat | Pima |
| Minimum | $23,690 | $24,821 |
| Maximum | $120,501 | $125,278 |
| Range | $96,811 | $100,457 |
| Mean | $77,500 | $67,157 |
| Median | $72,103 | $65,417 |
| Interquartile 25% (IQ1) | $54,583 | $53,298 |
| Interquartile 75% (IQ3) | $101,242 | $83,045 |
| Interquartile Range (IQR) | $46,659 | $29,747 |
| Standard Deviation (Sample) | $27,340 | $23,070 |
| Standard Deviation (Population) | $27,086 | $22,604 |
Similar Demographics by Median Family Income
Demographics Similar to Inupiat by Median Family Income
In terms of median family income, the demographic groups most similar to Inupiat are Liberian ($91,722, a difference of 0.010%), Pennsylvania German ($91,763, a difference of 0.040%), Cape Verdean ($91,848, a difference of 0.13%), Immigrants from West Indies ($91,588, a difference of 0.16%), and Osage ($91,926, a difference of 0.21%).
| Demographics | Rating | Rank | Median Family Income |
| Immigrants | Barbados | 0.5 /100 | #254 | Tragic $92,419 |
| Immigrants | Laos | 0.5 /100 | #255 | Tragic $92,239 |
| Nicaraguans | 0.5 /100 | #256 | Tragic $92,231 |
| Americans | 0.4 /100 | #257 | Tragic $92,096 |
| Osage | 0.4 /100 | #258 | Tragic $91,926 |
| Cape Verdeans | 0.4 /100 | #259 | Tragic $91,848 |
| Pennsylvania Germans | 0.4 /100 | #260 | Tragic $91,763 |
| Inupiat | 0.4 /100 | #261 | Tragic $91,730 |
| Liberians | 0.4 /100 | #262 | Tragic $91,722 |
| Immigrants | West Indies | 0.3 /100 | #263 | Tragic $91,588 |
| Senegalese | 0.3 /100 | #264 | Tragic $91,475 |
| Hmong | 0.3 /100 | #265 | Tragic $91,296 |
| Central Americans | 0.3 /100 | #266 | Tragic $91,087 |
| Mexican American Indians | 0.2 /100 | #267 | Tragic $90,918 |
| Cree | 0.2 /100 | #268 | Tragic $90,882 |
Demographics Similar to Pima by Median Family Income
In terms of median family income, the demographic groups most similar to Pima are Immigrants from Yemen ($77,457, a difference of 0.030%), Hopi ($77,188, a difference of 0.32%), Pueblo ($76,880, a difference of 0.72%), Yuman ($78,055, a difference of 0.80%), and Immigrants from Cuba ($78,249, a difference of 1.1%).
| Demographics | Rating | Rank | Median Family Income |
| Natives/Alaskans | 0.0 /100 | #332 | Tragic $80,908 |
| Kiowa | 0.0 /100 | #333 | Tragic $80,885 |
| Menominee | 0.0 /100 | #334 | Tragic $79,563 |
| Yup'ik | 0.0 /100 | #335 | Tragic $79,290 |
| Immigrants | Cuba | 0.0 /100 | #336 | Tragic $78,249 |
| Yuman | 0.0 /100 | #337 | Tragic $78,055 |
| Immigrants | Yemen | 0.0 /100 | #338 | Tragic $77,457 |
| Pima | 0.0 /100 | #339 | Tragic $77,431 |
| Hopi | 0.0 /100 | #340 | Tragic $77,188 |
| Pueblo | 0.0 /100 | #341 | Tragic $76,880 |
| Crow | 0.0 /100 | #342 | Tragic $76,605 |
| Houma | 0.0 /100 | #343 | Tragic $76,188 |
| Tohono O'odham | 0.0 /100 | #344 | Tragic $72,193 |
| Navajo | 0.0 /100 | #345 | Tragic $70,989 |
| Puerto Ricans | 0.0 /100 | #346 | Tragic $70,423 |