Inupiat vs Immigrants from Spain Child Poverty Among Boys Under 16
COMPARE
Inupiat
Immigrants from Spain
Child Poverty Among Boys Under 16
Child Poverty Among Boys Under 16 Comparison
Inupiat
Immigrants from Spain
18.1%
CHILD POVERTY AMONG BOYS UNDER 16
2.7/ 100
METRIC RATING
225th/ 347
METRIC RANK
15.6%
CHILD POVERTY AMONG BOYS UNDER 16
87.1/ 100
METRIC RATING
137th/ 347
METRIC RANK
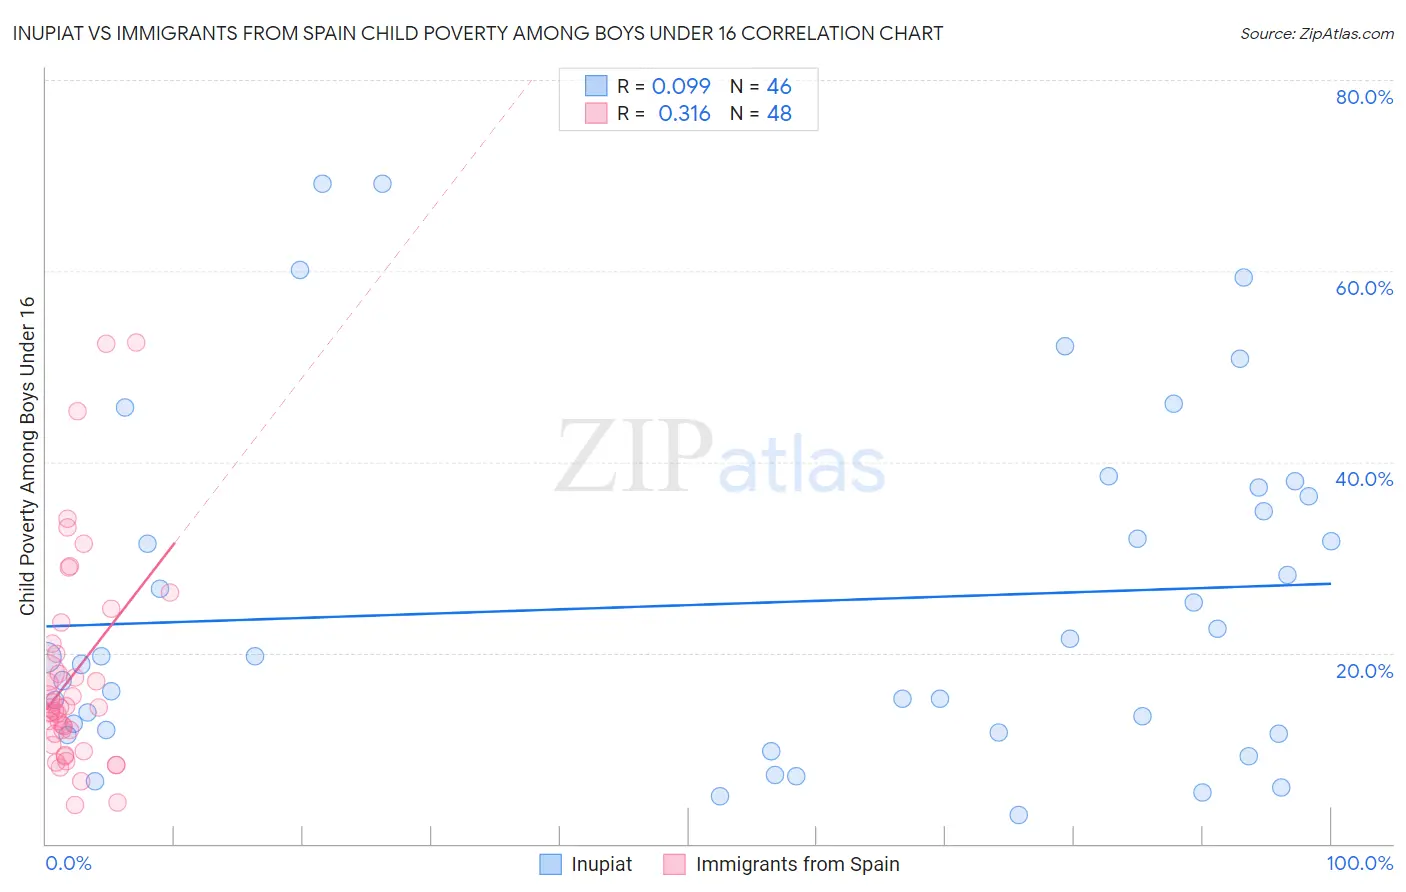
Inupiat vs Immigrants from Spain Child Poverty Among Boys Under 16 Correlation Chart
The statistical analysis conducted on geographies consisting of 96,013,278 people shows a slight positive correlation between the proportion of Inupiat and poverty level among boys under the age of 16 in the United States with a correlation coefficient (R) of 0.099 and weighted average of 18.1%. Similarly, the statistical analysis conducted on geographies consisting of 236,961,391 people shows a mild positive correlation between the proportion of Immigrants from Spain and poverty level among boys under the age of 16 in the United States with a correlation coefficient (R) of 0.316 and weighted average of 15.6%, a difference of 16.2%.
Child Poverty Among Boys Under 16 Correlation Summary
| Measurement | Inupiat | Immigrants from Spain |
| Minimum | 3.1% | 4.0% |
| Maximum | 69.2% | 52.5% |
| Range | 66.1% | 48.5% |
| Mean | 25.2% | 17.7% |
| Median | 19.6% | 14.2% |
| Interquartile 25% (IQ1) | 11.7% | 10.9% |
| Interquartile 75% (IQ3) | 36.4% | 20.4% |
| Interquartile Range (IQR) | 24.7% | 9.5% |
| Standard Deviation (Sample) | 17.8% | 11.1% |
| Standard Deviation (Population) | 17.6% | 11.0% |
Similar Demographics by Child Poverty Among Boys Under 16
Demographics Similar to Inupiat by Child Poverty Among Boys Under 16
In terms of child poverty among boys under 16, the demographic groups most similar to Inupiat are Immigrants from Africa (18.1%, a difference of 0.16%), Bermudan (18.1%, a difference of 0.26%), Nepalese (18.0%, a difference of 0.41%), Nonimmigrants (18.2%, a difference of 0.59%), and Cuban (17.9%, a difference of 0.89%).
| Demographics | Rating | Rank | Child Poverty Among Boys Under 16 |
| Iraqis | 5.5 /100 | #218 | Tragic 17.7% |
| Sierra Leoneans | 5.3 /100 | #219 | Tragic 17.8% |
| Immigrants | Cambodia | 5.1 /100 | #220 | Tragic 17.8% |
| Immigrants | Panama | 4.3 /100 | #221 | Tragic 17.9% |
| Pennsylvania Germans | 3.9 /100 | #222 | Tragic 17.9% |
| Cubans | 3.8 /100 | #223 | Tragic 17.9% |
| Nepalese | 3.2 /100 | #224 | Tragic 18.0% |
| Inupiat | 2.7 /100 | #225 | Tragic 18.1% |
| Immigrants | Africa | 2.6 /100 | #226 | Tragic 18.1% |
| Bermudans | 2.5 /100 | #227 | Tragic 18.1% |
| Immigrants | Nonimmigrants | 2.2 /100 | #228 | Tragic 18.2% |
| Immigrants | Micronesia | 1.8 /100 | #229 | Tragic 18.3% |
| Fijians | 1.8 /100 | #230 | Tragic 18.3% |
| Nicaraguans | 1.4 /100 | #231 | Tragic 18.4% |
| Marshallese | 1.3 /100 | #232 | Tragic 18.4% |
Demographics Similar to Immigrants from Spain by Child Poverty Among Boys Under 16
In terms of child poverty among boys under 16, the demographic groups most similar to Immigrants from Spain are Icelander (15.5%, a difference of 0.10%), Portuguese (15.5%, a difference of 0.11%), Immigrants from Southern Europe (15.6%, a difference of 0.15%), Albanian (15.6%, a difference of 0.15%), and Peruvian (15.5%, a difference of 0.29%).
| Demographics | Rating | Rank | Child Poverty Among Boys Under 16 |
| Mongolians | 90.2 /100 | #130 | Exceptional 15.4% |
| Immigrants | Western Europe | 90.0 /100 | #131 | Exceptional 15.4% |
| Immigrants | Kazakhstan | 88.7 /100 | #132 | Excellent 15.5% |
| Welsh | 88.3 /100 | #133 | Excellent 15.5% |
| Peruvians | 88.1 /100 | #134 | Excellent 15.5% |
| Portuguese | 87.5 /100 | #135 | Excellent 15.5% |
| Icelanders | 87.5 /100 | #136 | Excellent 15.5% |
| Immigrants | Spain | 87.1 /100 | #137 | Excellent 15.6% |
| Immigrants | Southern Europe | 86.5 /100 | #138 | Excellent 15.6% |
| Albanians | 86.5 /100 | #139 | Excellent 15.6% |
| Immigrants | Kuwait | 85.6 /100 | #140 | Excellent 15.6% |
| Slavs | 84.5 /100 | #141 | Excellent 15.7% |
| Immigrants | Hungary | 84.1 /100 | #142 | Excellent 15.7% |
| Immigrants | Fiji | 83.6 /100 | #143 | Excellent 15.7% |
| Immigrants | Peru | 83.5 /100 | #144 | Excellent 15.7% |