Korean vs Immigrants from Spain Per Capita Income
COMPARE
Korean
Immigrants from Spain
Per Capita Income
Per Capita Income Comparison
Koreans
Immigrants from Spain
$44,522
PER CAPITA INCOME
72.5/ 100
METRIC RATING
149th/ 347
METRIC RANK
$50,933
PER CAPITA INCOME
100.0/ 100
METRIC RATING
45th/ 347
METRIC RANK
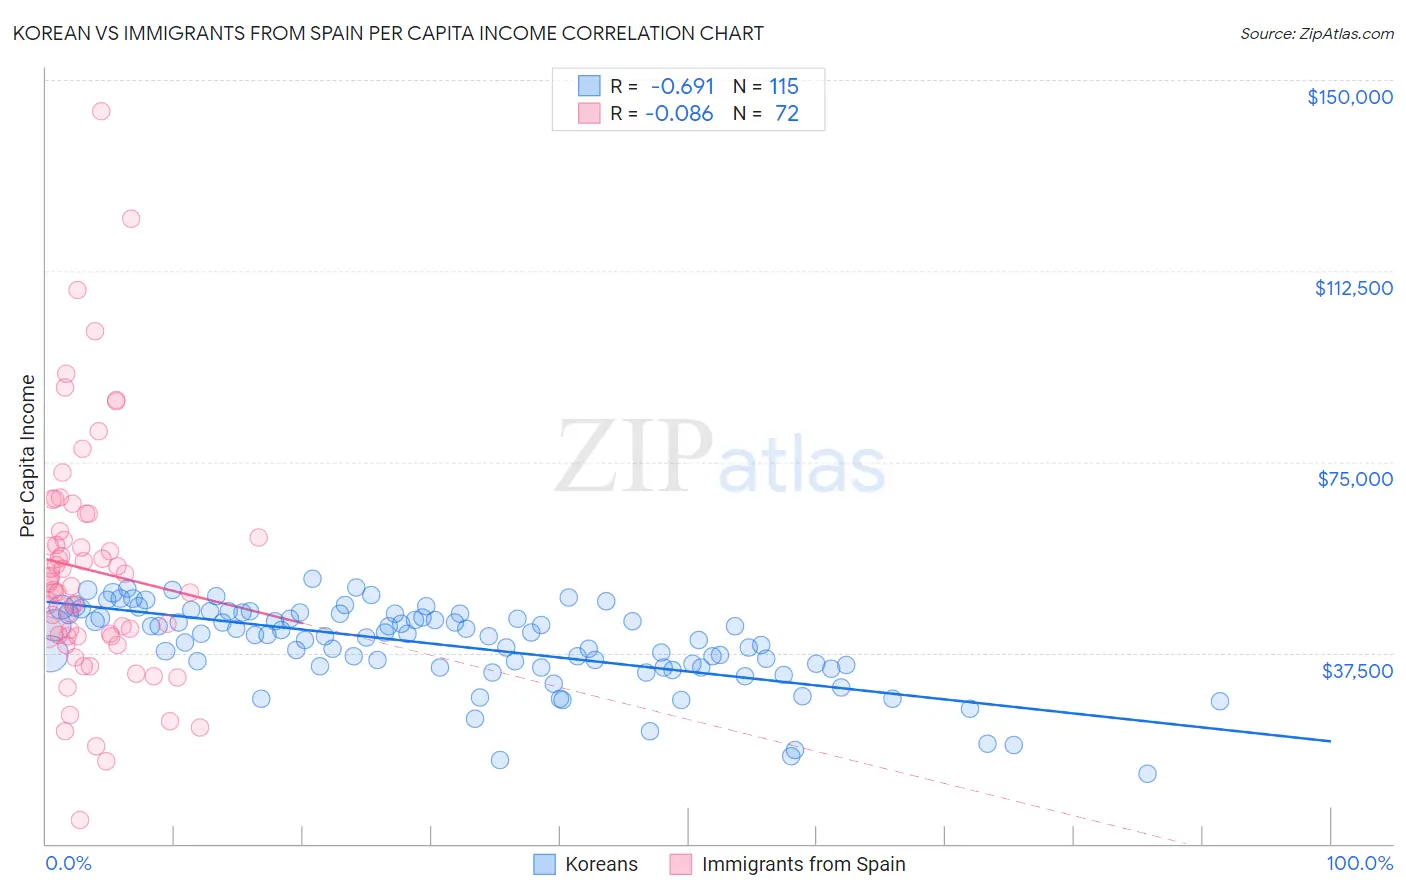
Korean vs Immigrants from Spain Per Capita Income Correlation Chart
The statistical analysis conducted on geographies consisting of 510,996,517 people shows a significant negative correlation between the proportion of Koreans and per capita income in the United States with a correlation coefficient (R) of -0.691 and weighted average of $44,522. Similarly, the statistical analysis conducted on geographies consisting of 239,686,141 people shows a slight negative correlation between the proportion of Immigrants from Spain and per capita income in the United States with a correlation coefficient (R) of -0.086 and weighted average of $50,933, a difference of 14.4%.
Per Capita Income Correlation Summary
| Measurement | Korean | Immigrants from Spain |
| Minimum | $13,802 | $4,617 |
| Maximum | $52,147 | $143,860 |
| Range | $38,345 | $139,243 |
| Mean | $38,981 | $53,783 |
| Median | $40,908 | $50,941 |
| Interquartile 25% (IQ1) | $34,687 | $40,770 |
| Interquartile 75% (IQ3) | $45,181 | $60,698 |
| Interquartile Range (IQR) | $10,494 | $19,928 |
| Standard Deviation (Sample) | $8,123 | $23,693 |
| Standard Deviation (Population) | $8,088 | $23,528 |
Similar Demographics by Per Capita Income
Demographics Similar to Koreans by Per Capita Income
In terms of per capita income, the demographic groups most similar to Koreans are Immigrants from Eritrea ($44,509, a difference of 0.030%), Immigrants from Armenia ($44,552, a difference of 0.070%), Norwegian ($44,480, a difference of 0.10%), Peruvian ($44,479, a difference of 0.10%), and Czech ($44,595, a difference of 0.16%).
| Demographics | Rating | Rank | Per Capita Income |
| Ugandans | 82.6 /100 | #142 | Excellent $45,047 |
| Immigrants | Uganda | 82.5 /100 | #143 | Excellent $45,043 |
| Icelanders | 81.6 /100 | #144 | Excellent $44,987 |
| Immigrants | Afghanistan | 78.0 /100 | #145 | Good $44,790 |
| Irish | 75.8 /100 | #146 | Good $44,679 |
| Czechs | 74.1 /100 | #147 | Good $44,595 |
| Immigrants | Armenia | 73.1 /100 | #148 | Good $44,552 |
| Koreans | 72.5 /100 | #149 | Good $44,522 |
| Immigrants | Eritrea | 72.1 /100 | #150 | Good $44,509 |
| Norwegians | 71.5 /100 | #151 | Good $44,480 |
| Peruvians | 71.5 /100 | #152 | Good $44,479 |
| Scottish | 70.6 /100 | #153 | Good $44,440 |
| Portuguese | 68.7 /100 | #154 | Good $44,362 |
| Uruguayans | 67.6 /100 | #155 | Good $44,318 |
| Slovaks | 65.4 /100 | #156 | Good $44,229 |
Demographics Similar to Immigrants from Spain by Per Capita Income
In terms of per capita income, the demographic groups most similar to Immigrants from Spain are Immigrants from Europe ($50,950, a difference of 0.030%), Immigrants from Latvia ($50,914, a difference of 0.040%), Bulgarian ($50,906, a difference of 0.050%), Immigrants from Serbia ($50,810, a difference of 0.24%), and New Zealander ($50,575, a difference of 0.71%).
| Demographics | Rating | Rank | Per Capita Income |
| Immigrants | Czechoslovakia | 100.0 /100 | #38 | Exceptional $51,770 |
| Cambodians | 100.0 /100 | #39 | Exceptional $51,731 |
| Immigrants | Korea | 100.0 /100 | #40 | Exceptional $51,671 |
| Immigrants | South Africa | 100.0 /100 | #41 | Exceptional $51,465 |
| Immigrants | Turkey | 100.0 /100 | #42 | Exceptional $51,368 |
| Immigrants | Lithuania | 100.0 /100 | #43 | Exceptional $51,361 |
| Immigrants | Europe | 100.0 /100 | #44 | Exceptional $50,950 |
| Immigrants | Spain | 100.0 /100 | #45 | Exceptional $50,933 |
| Immigrants | Latvia | 100.0 /100 | #46 | Exceptional $50,914 |
| Bulgarians | 100.0 /100 | #47 | Exceptional $50,906 |
| Immigrants | Serbia | 100.0 /100 | #48 | Exceptional $50,810 |
| New Zealanders | 100.0 /100 | #49 | Exceptional $50,575 |
| Immigrants | Sri Lanka | 100.0 /100 | #50 | Exceptional $50,555 |
| Immigrants | Netherlands | 100.0 /100 | #51 | Exceptional $50,458 |
| Immigrants | Croatia | 99.9 /100 | #52 | Exceptional $50,417 |