Inupiat vs Immigrants from Moldova Wage/Income Gap
COMPARE
Inupiat
Immigrants from Moldova
Wage/Income Gap
Wage/Income Gap Comparison
Inupiat
Immigrants from Moldova
20.8%
WAGE/INCOME GAP
100.0/ 100
METRIC RATING
28th/ 347
METRIC RANK
26.2%
WAGE/INCOME GAP
26.6/ 100
METRIC RATING
189th/ 347
METRIC RANK
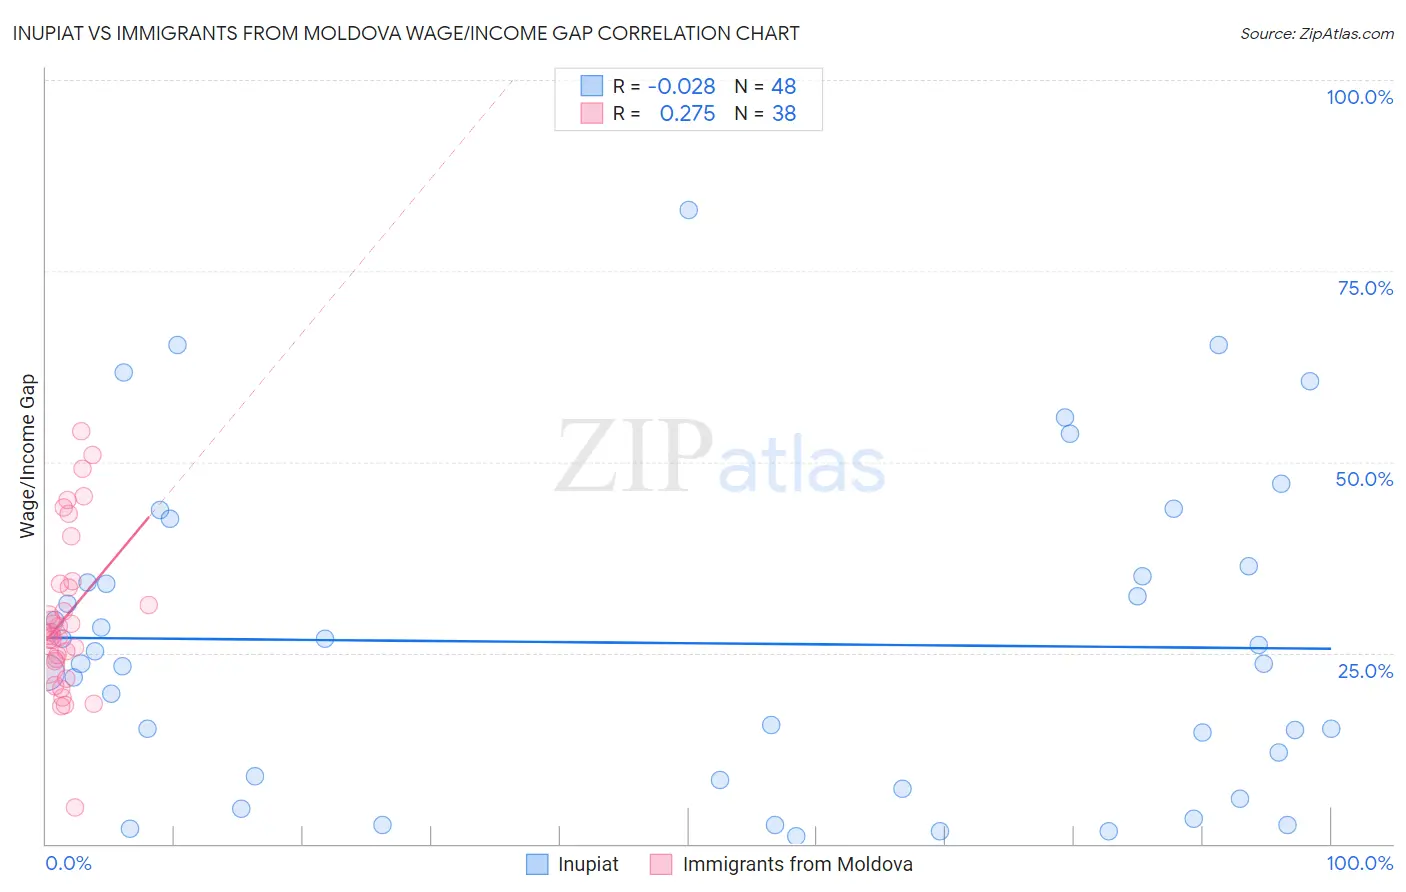
Inupiat vs Immigrants from Moldova Wage/Income Gap Correlation Chart
The statistical analysis conducted on geographies consisting of 96,290,792 people shows no correlation between the proportion of Inupiat and wage/income gap percentage in the United States with a correlation coefficient (R) of -0.028 and weighted average of 20.8%. Similarly, the statistical analysis conducted on geographies consisting of 124,386,174 people shows a weak positive correlation between the proportion of Immigrants from Moldova and wage/income gap percentage in the United States with a correlation coefficient (R) of 0.275 and weighted average of 26.2%, a difference of 26.1%.
Wage/Income Gap Correlation Summary
| Measurement | Inupiat | Immigrants from Moldova |
| Minimum | 0.97% | 4.7% |
| Maximum | 83.0% | 54.0% |
| Range | 82.0% | 49.3% |
| Mean | 26.3% | 29.8% |
| Median | 23.6% | 27.5% |
| Interquartile 25% (IQ1) | 8.6% | 23.8% |
| Interquartile 75% (IQ3) | 35.7% | 34.0% |
| Interquartile Range (IQR) | 27.1% | 10.2% |
| Standard Deviation (Sample) | 20.4% | 10.4% |
| Standard Deviation (Population) | 20.2% | 10.3% |
Similar Demographics by Wage/Income Gap
Demographics Similar to Inupiat by Wage/Income Gap
In terms of wage/income gap, the demographic groups most similar to Inupiat are Immigrants from Armenia (20.7%, a difference of 0.23%), Pueblo (20.7%, a difference of 0.43%), Senegalese (20.7%, a difference of 0.54%), Immigrants from Senegal (20.9%, a difference of 0.62%), and Immigrants from Bangladesh (20.9%, a difference of 0.84%).
| Demographics | Rating | Rank | Wage/Income Gap |
| Immigrants | Caribbean | 100.0 /100 | #21 | Exceptional 20.4% |
| Immigrants | Liberia | 100.0 /100 | #22 | Exceptional 20.6% |
| Immigrants | Dominican Republic | 100.0 /100 | #23 | Exceptional 20.6% |
| Dominicans | 100.0 /100 | #24 | Exceptional 20.6% |
| Senegalese | 100.0 /100 | #25 | Exceptional 20.7% |
| Pueblo | 100.0 /100 | #26 | Exceptional 20.7% |
| Immigrants | Armenia | 100.0 /100 | #27 | Exceptional 20.7% |
| Inupiat | 100.0 /100 | #28 | Exceptional 20.8% |
| Immigrants | Senegal | 100.0 /100 | #29 | Exceptional 20.9% |
| Immigrants | Bangladesh | 100.0 /100 | #30 | Exceptional 20.9% |
| Vietnamese | 100.0 /100 | #31 | Exceptional 21.0% |
| Immigrants | Yemen | 100.0 /100 | #32 | Exceptional 21.1% |
| Immigrants | Bahamas | 100.0 /100 | #33 | Exceptional 21.1% |
| Pima | 100.0 /100 | #34 | Exceptional 21.1% |
| Somalis | 100.0 /100 | #35 | Exceptional 21.2% |
Demographics Similar to Immigrants from Moldova by Wage/Income Gap
In terms of wage/income gap, the demographic groups most similar to Immigrants from Moldova are Immigrants from Croatia (26.2%, a difference of 0.15%), Immigrants from Venezuela (26.2%, a difference of 0.17%), Palestinian (26.1%, a difference of 0.26%), Immigrants from Egypt (26.1%, a difference of 0.26%), and Immigrants from Bulgaria (26.3%, a difference of 0.35%).
| Demographics | Rating | Rank | Wage/Income Gap |
| Immigrants | Serbia | 35.4 /100 | #182 | Fair 26.0% |
| Immigrants | Kazakhstan | 35.2 /100 | #183 | Fair 26.0% |
| Mexicans | 34.4 /100 | #184 | Fair 26.0% |
| Pakistanis | 33.7 /100 | #185 | Fair 26.1% |
| Immigrants | Indonesia | 32.5 /100 | #186 | Fair 26.1% |
| Palestinians | 29.9 /100 | #187 | Fair 26.1% |
| Immigrants | Egypt | 29.9 /100 | #188 | Fair 26.1% |
| Immigrants | Moldova | 26.6 /100 | #189 | Fair 26.2% |
| Immigrants | Croatia | 24.8 /100 | #190 | Fair 26.2% |
| Immigrants | Venezuela | 24.7 /100 | #191 | Fair 26.2% |
| Immigrants | Bulgaria | 22.5 /100 | #192 | Fair 26.3% |
| Immigrants | Jordan | 22.4 /100 | #193 | Fair 26.3% |
| Chileans | 22.3 /100 | #194 | Fair 26.3% |
| Immigrants | Malaysia | 22.2 /100 | #195 | Fair 26.3% |
| Immigrants | Western Asia | 21.7 /100 | #196 | Fair 26.3% |