Immigrants from Russia vs Immigrants from Cambodia Median Family Income
COMPARE
Immigrants from Russia
Immigrants from Cambodia
Median Family Income
Median Family Income Comparison
Immigrants from Russia
Immigrants from Cambodia
$116,942
MEDIAN FAMILY INCOME
99.9/ 100
METRIC RATING
46th/ 347
METRIC RANK
$97,222
MEDIAN FAMILY INCOME
5.8/ 100
METRIC RATING
218th/ 347
METRIC RANK
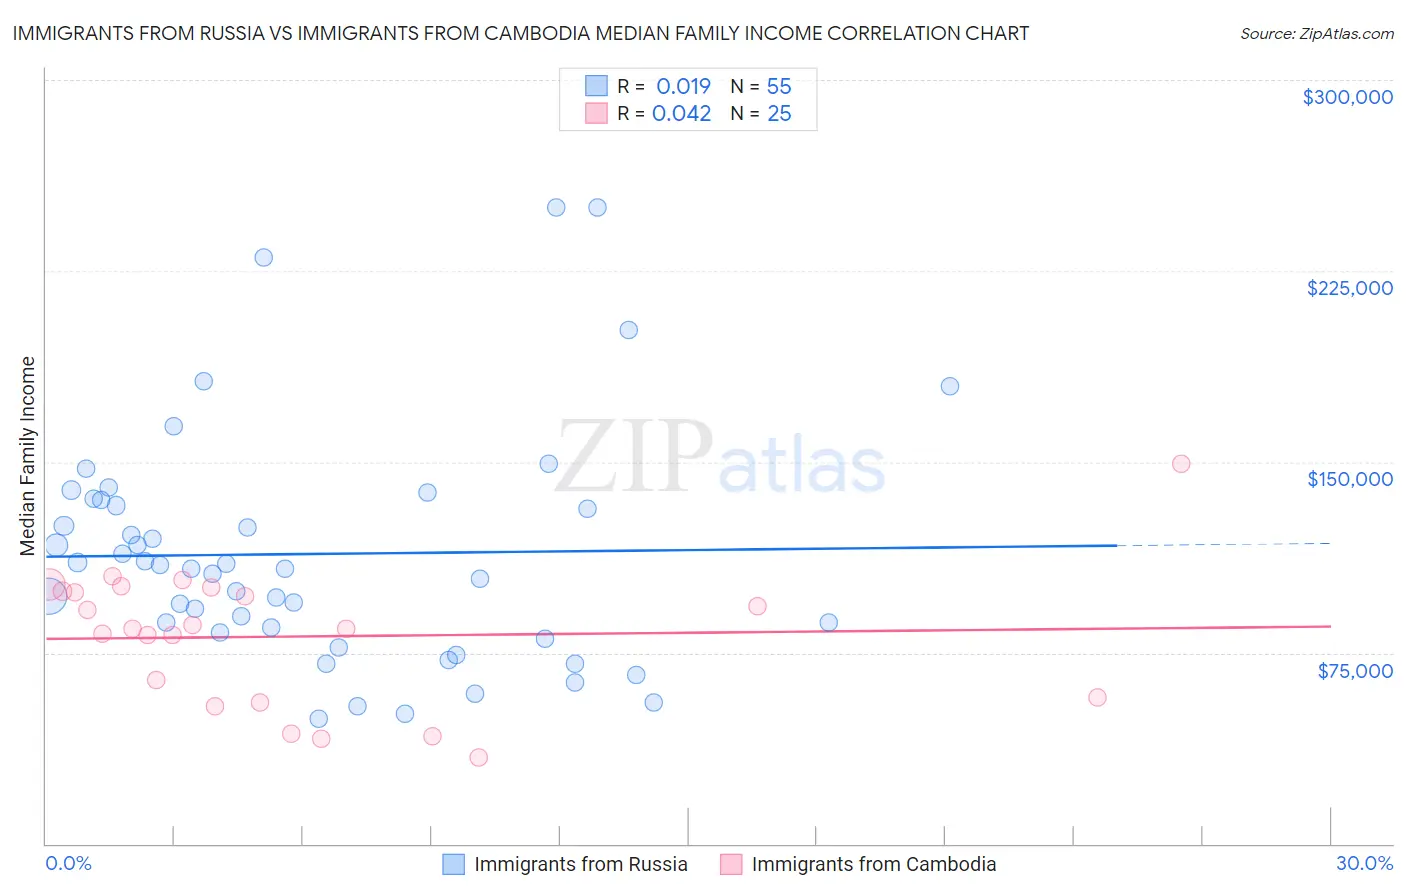
Immigrants from Russia vs Immigrants from Cambodia Median Family Income Correlation Chart
The statistical analysis conducted on geographies consisting of 347,641,134 people shows no correlation between the proportion of Immigrants from Russia and median family income in the United States with a correlation coefficient (R) of 0.019 and weighted average of $116,942. Similarly, the statistical analysis conducted on geographies consisting of 205,119,911 people shows no correlation between the proportion of Immigrants from Cambodia and median family income in the United States with a correlation coefficient (R) of 0.042 and weighted average of $97,222, a difference of 20.3%.
Median Family Income Correlation Summary
| Measurement | Immigrants from Russia | Immigrants from Cambodia |
| Minimum | $49,167 | $34,076 |
| Maximum | $250,001 | $149,239 |
| Range | $200,834 | $115,163 |
| Mean | $113,842 | $81,395 |
| Median | $107,999 | $84,615 |
| Interquartile 25% (IQ1) | $83,101 | $56,570 |
| Interquartile 75% (IQ3) | $134,951 | $99,835 |
| Interquartile Range (IQR) | $51,850 | $43,265 |
| Standard Deviation (Sample) | $46,059 | $26,680 |
| Standard Deviation (Population) | $45,638 | $26,141 |
Similar Demographics by Median Family Income
Demographics Similar to Immigrants from Russia by Median Family Income
In terms of median family income, the demographic groups most similar to Immigrants from Russia are Immigrants from Austria ($116,830, a difference of 0.10%), Immigrants from Greece ($117,344, a difference of 0.34%), Immigrants from South Africa ($116,286, a difference of 0.56%), Chinese ($116,188, a difference of 0.65%), and Immigrants from Czechoslovakia ($116,165, a difference of 0.67%).
| Demographics | Rating | Rank | Median Family Income |
| Immigrants | Asia | 100.0 /100 | #39 | Exceptional $118,291 |
| Immigrants | Lithuania | 100.0 /100 | #40 | Exceptional $118,053 |
| Estonians | 100.0 /100 | #41 | Exceptional $118,013 |
| Immigrants | Bolivia | 100.0 /100 | #42 | Exceptional $117,912 |
| Bulgarians | 100.0 /100 | #43 | Exceptional $117,818 |
| Cambodians | 100.0 /100 | #44 | Exceptional $117,780 |
| Immigrants | Greece | 99.9 /100 | #45 | Exceptional $117,344 |
| Immigrants | Russia | 99.9 /100 | #46 | Exceptional $116,942 |
| Immigrants | Austria | 99.9 /100 | #47 | Exceptional $116,830 |
| Immigrants | South Africa | 99.9 /100 | #48 | Exceptional $116,286 |
| Chinese | 99.9 /100 | #49 | Exceptional $116,188 |
| Immigrants | Czechoslovakia | 99.9 /100 | #50 | Exceptional $116,165 |
| Immigrants | Malaysia | 99.9 /100 | #51 | Exceptional $115,880 |
| Maltese | 99.9 /100 | #52 | Exceptional $115,862 |
| Immigrants | Norway | 99.9 /100 | #53 | Exceptional $115,847 |
Demographics Similar to Immigrants from Cambodia by Median Family Income
In terms of median family income, the demographic groups most similar to Immigrants from Cambodia are Japanese ($97,288, a difference of 0.070%), Immigrants from Bosnia and Herzegovina ($97,432, a difference of 0.22%), Delaware ($96,958, a difference of 0.27%), Nigerian ($97,522, a difference of 0.31%), and Bermudan ($97,577, a difference of 0.36%).
| Demographics | Rating | Rank | Median Family Income |
| Immigrants | Sudan | 7.4 /100 | #211 | Tragic $97,737 |
| Panamanians | 7.2 /100 | #212 | Tragic $97,683 |
| Immigrants | Armenia | 7.0 /100 | #213 | Tragic $97,605 |
| Bermudans | 6.9 /100 | #214 | Tragic $97,577 |
| Nigerians | 6.7 /100 | #215 | Tragic $97,522 |
| Immigrants | Bosnia and Herzegovina | 6.4 /100 | #216 | Tragic $97,432 |
| Japanese | 6.0 /100 | #217 | Tragic $97,288 |
| Immigrants | Cambodia | 5.8 /100 | #218 | Tragic $97,222 |
| Delaware | 5.1 /100 | #219 | Tragic $96,958 |
| Sudanese | 4.7 /100 | #220 | Tragic $96,783 |
| Immigrants | Ghana | 4.2 /100 | #221 | Tragic $96,544 |
| Immigrants | Nigeria | 4.0 /100 | #222 | Tragic $96,439 |
| Venezuelans | 3.7 /100 | #223 | Tragic $96,281 |
| Immigrants | Nonimmigrants | 3.6 /100 | #224 | Tragic $96,231 |
| Vietnamese | 3.4 /100 | #225 | Tragic $96,123 |