Indian (Asian) vs Venezuelan Median Earnings
COMPARE
Indian (Asian)
Venezuelan
Median Earnings
Median Earnings Comparison
Indians (Asian)
Venezuelans
$56,253
MEDIAN EARNINGS
100.0/ 100
METRIC RATING
15th/ 347
METRIC RANK
$44,580
MEDIAN EARNINGS
6.9/ 100
METRIC RATING
235th/ 347
METRIC RANK
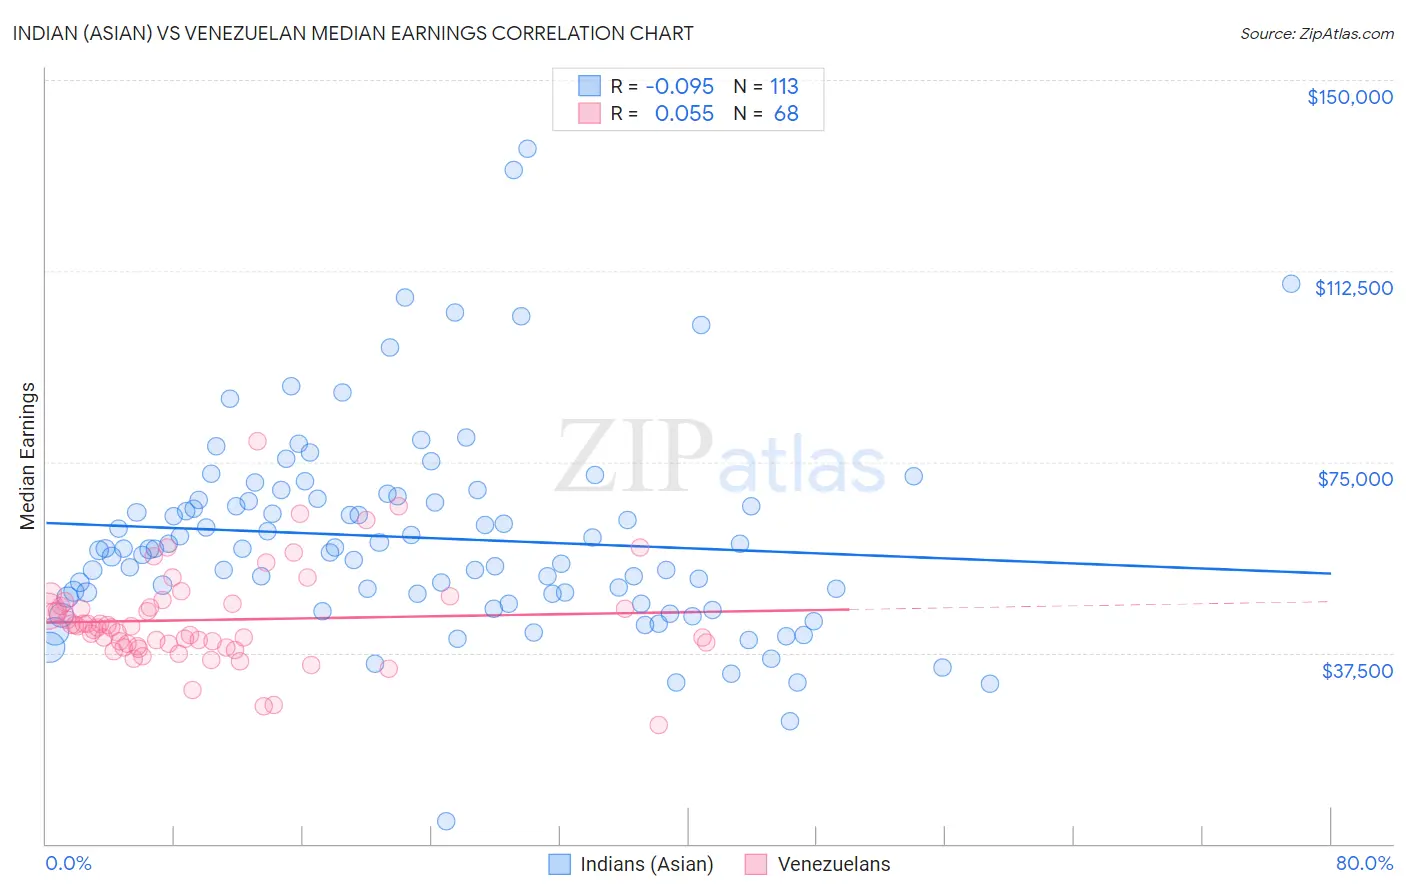
Indian (Asian) vs Venezuelan Median Earnings Correlation Chart
The statistical analysis conducted on geographies consisting of 495,313,309 people shows a slight negative correlation between the proportion of Indians (Asian) and median earnings in the United States with a correlation coefficient (R) of -0.095 and weighted average of $56,253. Similarly, the statistical analysis conducted on geographies consisting of 306,328,741 people shows a slight positive correlation between the proportion of Venezuelans and median earnings in the United States with a correlation coefficient (R) of 0.055 and weighted average of $44,580, a difference of 26.2%.
Median Earnings Correlation Summary
| Measurement | Indian (Asian) | Venezuelan |
| Minimum | $4,382 | $23,314 |
| Maximum | $136,388 | $78,969 |
| Range | $132,006 | $55,655 |
| Mean | $60,085 | $43,969 |
| Median | $57,869 | $42,571 |
| Interquartile 25% (IQ1) | $48,728 | $39,048 |
| Interquartile 75% (IQ3) | $67,622 | $46,866 |
| Interquartile Range (IQR) | $18,894 | $7,818 |
| Standard Deviation (Sample) | $20,110 | $9,261 |
| Standard Deviation (Population) | $20,020 | $9,192 |
Similar Demographics by Median Earnings
Demographics Similar to Indians (Asian) by Median Earnings
In terms of median earnings, the demographic groups most similar to Indians (Asian) are Immigrants from Australia ($56,305, a difference of 0.090%), Immigrants from Eastern Asia ($56,183, a difference of 0.12%), Immigrants from China ($56,638, a difference of 0.68%), Immigrants from Ireland ($56,854, a difference of 1.1%), and Immigrants from Israel ($57,034, a difference of 1.4%).
| Demographics | Rating | Rank | Median Earnings |
| Immigrants | Iran | 100.0 /100 | #8 | Exceptional $57,612 |
| Okinawans | 100.0 /100 | #9 | Exceptional $57,550 |
| Immigrants | South Central Asia | 100.0 /100 | #10 | Exceptional $57,114 |
| Immigrants | Israel | 100.0 /100 | #11 | Exceptional $57,034 |
| Immigrants | Ireland | 100.0 /100 | #12 | Exceptional $56,854 |
| Immigrants | China | 100.0 /100 | #13 | Exceptional $56,638 |
| Immigrants | Australia | 100.0 /100 | #14 | Exceptional $56,305 |
| Indians (Asian) | 100.0 /100 | #15 | Exceptional $56,253 |
| Immigrants | Eastern Asia | 100.0 /100 | #16 | Exceptional $56,183 |
| Eastern Europeans | 100.0 /100 | #17 | Exceptional $55,084 |
| Immigrants | Japan | 100.0 /100 | #18 | Exceptional $54,938 |
| Immigrants | Belgium | 100.0 /100 | #19 | Exceptional $54,679 |
| Cypriots | 100.0 /100 | #20 | Exceptional $54,589 |
| Burmese | 100.0 /100 | #21 | Exceptional $54,559 |
| Immigrants | Korea | 100.0 /100 | #22 | Exceptional $54,530 |
Demographics Similar to Venezuelans by Median Earnings
In terms of median earnings, the demographic groups most similar to Venezuelans are British West Indian ($44,552, a difference of 0.060%), Cape Verdean ($44,640, a difference of 0.14%), Immigrants from Ecuador ($44,462, a difference of 0.27%), Sudanese ($44,419, a difference of 0.36%), and Immigrants from Sudan ($44,767, a difference of 0.42%).
| Demographics | Rating | Rank | Median Earnings |
| Immigrants | Iraq | 11.6 /100 | #228 | Poor $44,988 |
| Scotch-Irish | 10.7 /100 | #229 | Poor $44,924 |
| Immigrants | Western Africa | 10.3 /100 | #230 | Poor $44,893 |
| Japanese | 9.5 /100 | #231 | Tragic $44,825 |
| Delaware | 9.0 /100 | #232 | Tragic $44,783 |
| Immigrants | Sudan | 8.8 /100 | #233 | Tragic $44,767 |
| Cape Verdeans | 7.5 /100 | #234 | Tragic $44,640 |
| Venezuelans | 6.9 /100 | #235 | Tragic $44,580 |
| British West Indians | 6.7 /100 | #236 | Tragic $44,552 |
| Immigrants | Ecuador | 5.9 /100 | #237 | Tragic $44,462 |
| Sudanese | 5.6 /100 | #238 | Tragic $44,419 |
| Senegalese | 5.3 /100 | #239 | Tragic $44,373 |
| Aleuts | 4.4 /100 | #240 | Tragic $44,241 |
| Samoans | 4.2 /100 | #241 | Tragic $44,206 |
| Immigrants | Venezuela | 4.0 /100 | #242 | Tragic $44,163 |