Indian (Asian) vs Immigrants from France Median Earnings
COMPARE
Indian (Asian)
Immigrants from France
Median Earnings
Median Earnings Comparison
Indians (Asian)
Immigrants from France
$56,253
MEDIAN EARNINGS
100.0/ 100
METRIC RATING
15th/ 347
METRIC RANK
$53,490
MEDIAN EARNINGS
100.0/ 100
METRIC RATING
28th/ 347
METRIC RANK
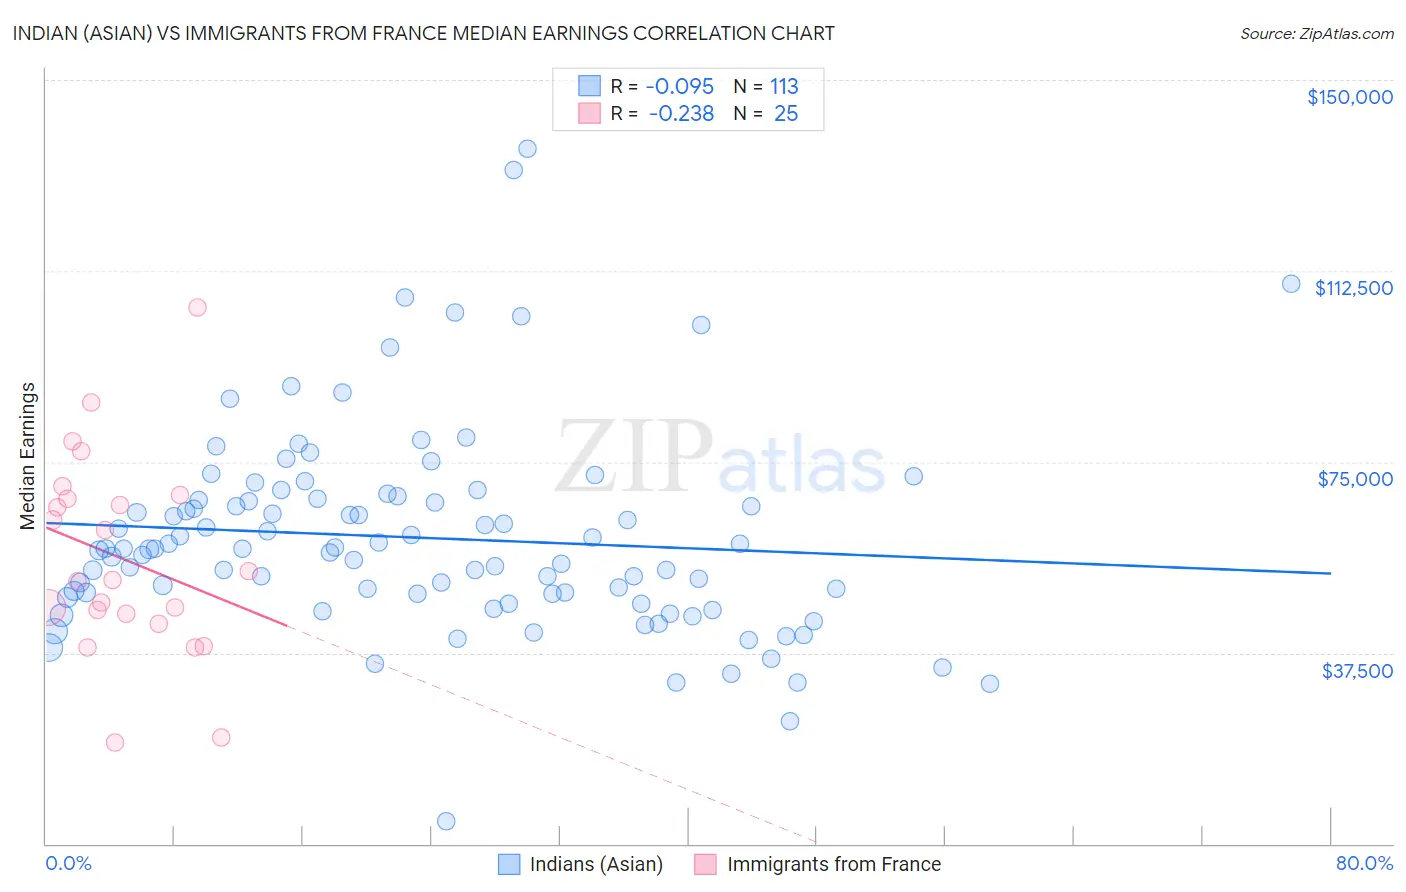
Indian (Asian) vs Immigrants from France Median Earnings Correlation Chart
The statistical analysis conducted on geographies consisting of 495,313,309 people shows a slight negative correlation between the proportion of Indians (Asian) and median earnings in the United States with a correlation coefficient (R) of -0.095 and weighted average of $56,253. Similarly, the statistical analysis conducted on geographies consisting of 287,897,093 people shows a weak negative correlation between the proportion of Immigrants from France and median earnings in the United States with a correlation coefficient (R) of -0.238 and weighted average of $53,490, a difference of 5.2%.
Median Earnings Correlation Summary
| Measurement | Indian (Asian) | Immigrants from France |
| Minimum | $4,382 | $19,781 |
| Maximum | $136,388 | $105,221 |
| Range | $132,006 | $85,440 |
| Mean | $60,085 | $56,012 |
| Median | $57,869 | $51,881 |
| Interquartile 25% (IQ1) | $48,728 | $44,190 |
| Interquartile 75% (IQ3) | $67,622 | $68,204 |
| Interquartile Range (IQR) | $18,894 | $24,013 |
| Standard Deviation (Sample) | $20,110 | $19,673 |
| Standard Deviation (Population) | $20,020 | $19,276 |
Demographics Similar to Indians (Asian) and Immigrants from France by Median Earnings
In terms of median earnings, the demographic groups most similar to Indians (Asian) are Immigrants from Australia ($56,305, a difference of 0.090%), Immigrants from Eastern Asia ($56,183, a difference of 0.12%), Immigrants from China ($56,638, a difference of 0.68%), Immigrants from Ireland ($56,854, a difference of 1.1%), and Immigrants from Israel ($57,034, a difference of 1.4%). Similarly, the demographic groups most similar to Immigrants from France are Immigrants from Russia ($53,457, a difference of 0.060%), Cambodian ($53,386, a difference of 0.20%), Russian ($53,334, a difference of 0.29%), Asian ($53,690, a difference of 0.37%), and Immigrants from Northern Europe ($53,872, a difference of 0.71%).
| Demographics | Rating | Rank | Median Earnings |
| Immigrants | Israel | 100.0 /100 | #11 | Exceptional $57,034 |
| Immigrants | Ireland | 100.0 /100 | #12 | Exceptional $56,854 |
| Immigrants | China | 100.0 /100 | #13 | Exceptional $56,638 |
| Immigrants | Australia | 100.0 /100 | #14 | Exceptional $56,305 |
| Indians (Asian) | 100.0 /100 | #15 | Exceptional $56,253 |
| Immigrants | Eastern Asia | 100.0 /100 | #16 | Exceptional $56,183 |
| Eastern Europeans | 100.0 /100 | #17 | Exceptional $55,084 |
| Immigrants | Japan | 100.0 /100 | #18 | Exceptional $54,938 |
| Immigrants | Belgium | 100.0 /100 | #19 | Exceptional $54,679 |
| Cypriots | 100.0 /100 | #20 | Exceptional $54,589 |
| Burmese | 100.0 /100 | #21 | Exceptional $54,559 |
| Immigrants | Korea | 100.0 /100 | #22 | Exceptional $54,530 |
| Immigrants | Sweden | 100.0 /100 | #23 | Exceptional $54,478 |
| Soviet Union | 100.0 /100 | #24 | Exceptional $54,290 |
| Turks | 100.0 /100 | #25 | Exceptional $53,919 |
| Immigrants | Northern Europe | 100.0 /100 | #26 | Exceptional $53,872 |
| Asians | 100.0 /100 | #27 | Exceptional $53,690 |
| Immigrants | France | 100.0 /100 | #28 | Exceptional $53,490 |
| Immigrants | Russia | 100.0 /100 | #29 | Exceptional $53,457 |
| Cambodians | 100.0 /100 | #30 | Exceptional $53,386 |
| Russians | 100.0 /100 | #31 | Exceptional $53,334 |