Immigrants from Western Africa vs Immigrants from Senegal Median Family Income
COMPARE
Immigrants from Western Africa
Immigrants from Senegal
Median Family Income
Median Family Income Comparison
Immigrants from Western Africa
Immigrants from Senegal
$94,638
MEDIAN FAMILY INCOME
1.6/ 100
METRIC RATING
234th/ 347
METRIC RANK
$92,912
MEDIAN FAMILY INCOME
0.7/ 100
METRIC RATING
247th/ 347
METRIC RANK
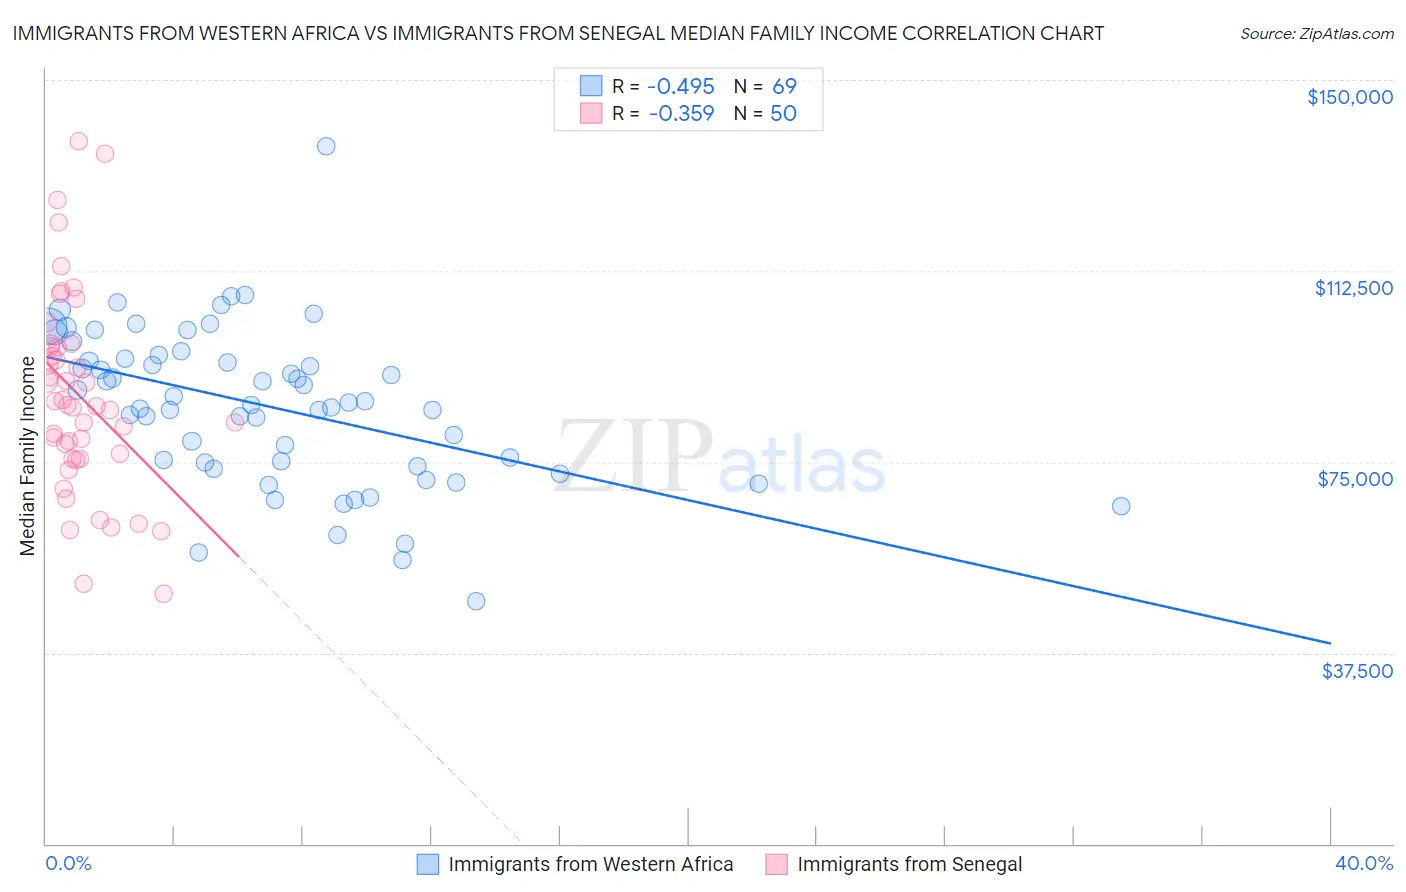
Immigrants from Western Africa vs Immigrants from Senegal Median Family Income Correlation Chart
The statistical analysis conducted on geographies consisting of 357,410,586 people shows a moderate negative correlation between the proportion of Immigrants from Western Africa and median family income in the United States with a correlation coefficient (R) of -0.495 and weighted average of $94,638. Similarly, the statistical analysis conducted on geographies consisting of 90,105,018 people shows a mild negative correlation between the proportion of Immigrants from Senegal and median family income in the United States with a correlation coefficient (R) of -0.359 and weighted average of $92,912, a difference of 1.9%.
Median Family Income Correlation Summary
| Measurement | Immigrants from Western Africa | Immigrants from Senegal |
| Minimum | $47,599 | $49,167 |
| Maximum | $136,923 | $137,892 |
| Range | $89,324 | $88,725 |
| Mean | $85,944 | $87,849 |
| Median | $86,589 | $85,966 |
| Interquartile 25% (IQ1) | $74,581 | $75,730 |
| Interquartile 75% (IQ3) | $95,623 | $97,800 |
| Interquartile Range (IQR) | $21,043 | $22,070 |
| Standard Deviation (Sample) | $15,373 | $19,522 |
| Standard Deviation (Population) | $15,261 | $19,326 |
Demographics Similar to Immigrants from Western Africa and Immigrants from Senegal by Median Family Income
In terms of median family income, the demographic groups most similar to Immigrants from Western Africa are Immigrants from Bangladesh ($94,665, a difference of 0.030%), Immigrants from Burma/Myanmar ($94,472, a difference of 0.18%), Trinidadian and Tobagonian ($94,466, a difference of 0.18%), Alaskan Athabascan ($94,429, a difference of 0.22%), and Immigrants from Venezuela ($94,904, a difference of 0.28%). Similarly, the demographic groups most similar to Immigrants from Senegal are French American Indian ($92,872, a difference of 0.040%), Immigrants from Ecuador ($92,837, a difference of 0.080%), West Indian ($92,765, a difference of 0.16%), Guyanese ($93,373, a difference of 0.50%), and Immigrants from Middle Africa ($93,593, a difference of 0.73%).
| Demographics | Rating | Rank | Median Family Income |
| Malaysians | 2.2 /100 | #230 | Tragic $95,230 |
| Ecuadorians | 2.1 /100 | #231 | Tragic $95,114 |
| Immigrants | Venezuela | 1.9 /100 | #232 | Tragic $94,904 |
| Immigrants | Bangladesh | 1.6 /100 | #233 | Tragic $94,665 |
| Immigrants | Western Africa | 1.6 /100 | #234 | Tragic $94,638 |
| Immigrants | Burma/Myanmar | 1.5 /100 | #235 | Tragic $94,472 |
| Trinidadians and Tobagonians | 1.5 /100 | #236 | Tragic $94,466 |
| Alaskan Athabascans | 1.5 /100 | #237 | Tragic $94,429 |
| Nepalese | 1.3 /100 | #238 | Tragic $94,153 |
| Salvadorans | 1.2 /100 | #239 | Tragic $94,109 |
| Somalis | 1.2 /100 | #240 | Tragic $94,085 |
| Immigrants | Trinidad and Tobago | 1.2 /100 | #241 | Tragic $93,988 |
| Barbadians | 1.1 /100 | #242 | Tragic $93,919 |
| German Russians | 1.1 /100 | #243 | Tragic $93,858 |
| Sub-Saharan Africans | 1.0 /100 | #244 | Tragic $93,748 |
| Immigrants | Middle Africa | 1.0 /100 | #245 | Tragic $93,593 |
| Guyanese | 0.9 /100 | #246 | Tragic $93,373 |
| Immigrants | Senegal | 0.7 /100 | #247 | Tragic $92,912 |
| French American Indians | 0.7 /100 | #248 | Tragic $92,872 |
| Immigrants | Ecuador | 0.7 /100 | #249 | Tragic $92,837 |
| West Indians | 0.6 /100 | #250 | Tragic $92,765 |