Immigrants from Western Africa vs Immigrants from Switzerland Householder Income Ages 45 - 64 years
COMPARE
Immigrants from Western Africa
Immigrants from Switzerland
Householder Income Ages 45 - 64 years
Householder Income Ages 45 - 64 years Comparison
Immigrants from Western Africa
Immigrants from Switzerland
$92,384
HOUSEHOLDER INCOME AGES 45 - 64 YEARS
1.8/ 100
METRIC RATING
236th/ 347
METRIC RANK
$115,934
HOUSEHOLDER INCOME AGES 45 - 64 YEARS
100.0/ 100
METRIC RATING
36th/ 347
METRIC RANK
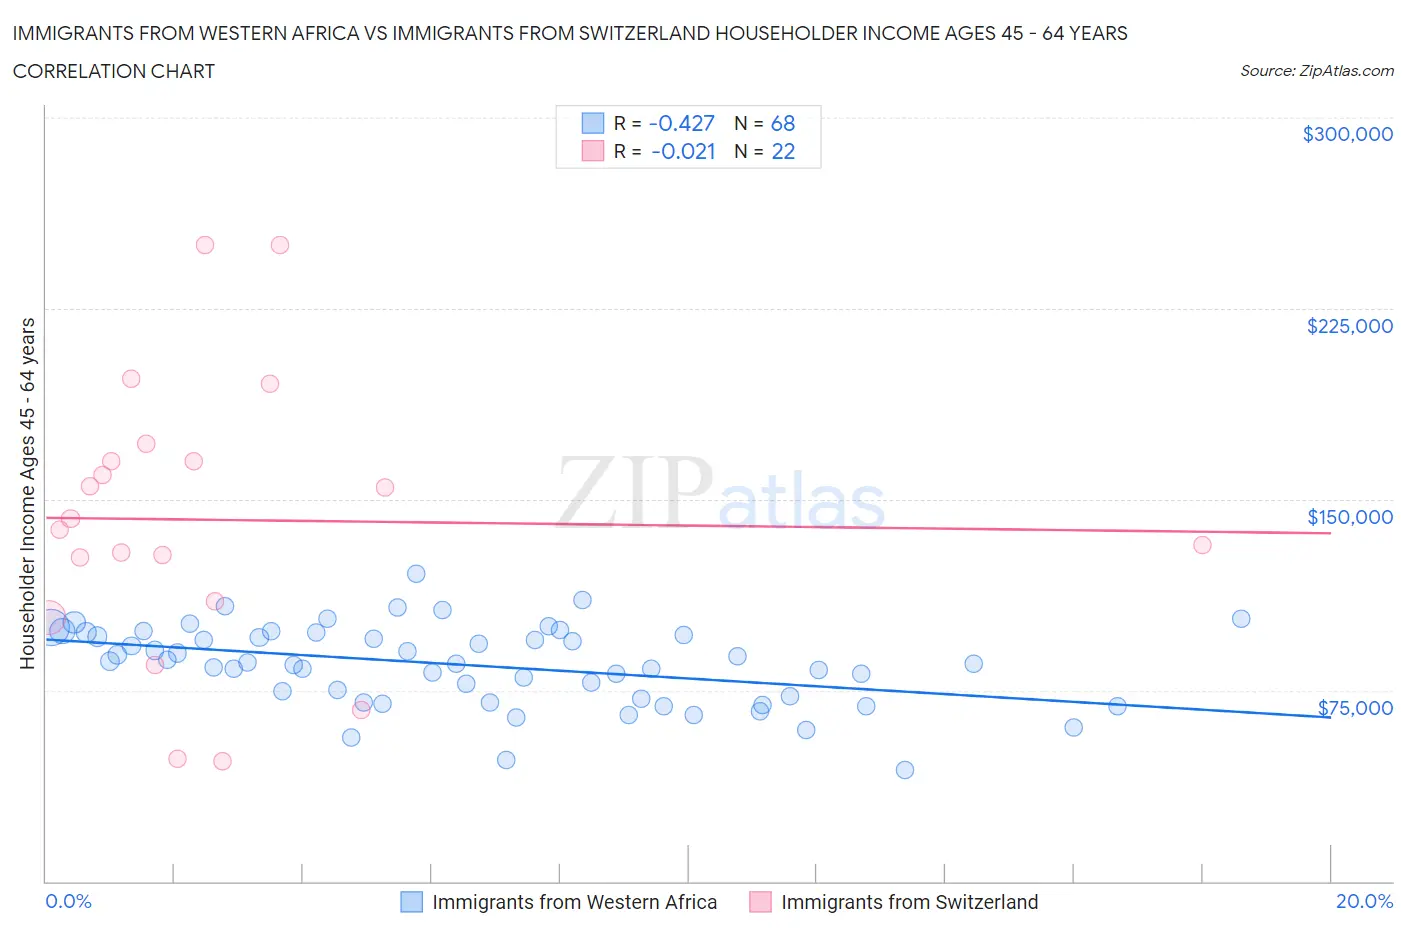
Immigrants from Western Africa vs Immigrants from Switzerland Householder Income Ages 45 - 64 years Correlation Chart
The statistical analysis conducted on geographies consisting of 357,146,562 people shows a moderate negative correlation between the proportion of Immigrants from Western Africa and household income with householder between the ages 45 and 64 in the United States with a correlation coefficient (R) of -0.427 and weighted average of $92,384. Similarly, the statistical analysis conducted on geographies consisting of 148,019,607 people shows no correlation between the proportion of Immigrants from Switzerland and household income with householder between the ages 45 and 64 in the United States with a correlation coefficient (R) of -0.021 and weighted average of $115,934, a difference of 25.5%.
Householder Income Ages 45 - 64 years Correlation Summary
| Measurement | Immigrants from Western Africa | Immigrants from Switzerland |
| Minimum | $43,559 | $47,188 |
| Maximum | $120,552 | $250,001 |
| Range | $76,993 | $202,813 |
| Mean | $84,916 | $141,958 |
| Median | $85,582 | $140,273 |
| Interquartile 25% (IQ1) | $72,214 | $109,782 |
| Interquartile 75% (IQ3) | $97,099 | $165,133 |
| Interquartile Range (IQR) | $24,885 | $55,351 |
| Standard Deviation (Sample) | $15,570 | $54,182 |
| Standard Deviation (Population) | $15,455 | $52,936 |
Similar Demographics by Householder Income Ages 45 - 64 years
Demographics Similar to Immigrants from Western Africa by Householder Income Ages 45 - 64 years
In terms of householder income ages 45 - 64 years, the demographic groups most similar to Immigrants from Western Africa are Nicaraguan ($92,554, a difference of 0.18%), Immigrants from Bangladesh ($92,208, a difference of 0.19%), Pennsylvania German ($91,956, a difference of 0.46%), Immigrants from El Salvador ($93,176, a difference of 0.86%), and Immigrants from Ecuador ($91,462, a difference of 1.0%).
| Demographics | Rating | Rank | Householder Income Ages 45 - 64 years |
| Vietnamese | 3.6 /100 | #229 | Tragic $93,788 |
| Immigrants | Sudan | 3.6 /100 | #230 | Tragic $93,781 |
| Ecuadorians | 3.6 /100 | #231 | Tragic $93,739 |
| Sudanese | 3.5 /100 | #232 | Tragic $93,718 |
| Nepalese | 3.0 /100 | #233 | Tragic $93,355 |
| Immigrants | El Salvador | 2.7 /100 | #234 | Tragic $93,176 |
| Nicaraguans | 2.0 /100 | #235 | Tragic $92,554 |
| Immigrants | Western Africa | 1.8 /100 | #236 | Tragic $92,384 |
| Immigrants | Bangladesh | 1.7 /100 | #237 | Tragic $92,208 |
| Pennsylvania Germans | 1.5 /100 | #238 | Tragic $91,956 |
| Immigrants | Ecuador | 1.2 /100 | #239 | Tragic $91,462 |
| Immigrants | Burma/Myanmar | 1.1 /100 | #240 | Tragic $91,385 |
| Trinidadians and Tobagonians | 1.1 /100 | #241 | Tragic $91,357 |
| Inupiat | 1.1 /100 | #242 | Tragic $91,355 |
| Immigrants | Trinidad and Tobago | 1.1 /100 | #243 | Tragic $91,347 |
Demographics Similar to Immigrants from Switzerland by Householder Income Ages 45 - 64 years
In terms of householder income ages 45 - 64 years, the demographic groups most similar to Immigrants from Switzerland are Latvian ($115,957, a difference of 0.020%), Immigrants from Denmark ($116,000, a difference of 0.060%), Chinese ($116,156, a difference of 0.19%), Russian ($116,328, a difference of 0.34%), and Immigrants from Asia ($116,566, a difference of 0.54%).
| Demographics | Rating | Rank | Householder Income Ages 45 - 64 years |
| Bhutanese | 100.0 /100 | #29 | Exceptional $117,750 |
| Immigrants | Bolivia | 100.0 /100 | #30 | Exceptional $117,731 |
| Immigrants | Asia | 100.0 /100 | #31 | Exceptional $116,566 |
| Russians | 100.0 /100 | #32 | Exceptional $116,328 |
| Chinese | 100.0 /100 | #33 | Exceptional $116,156 |
| Immigrants | Denmark | 100.0 /100 | #34 | Exceptional $116,000 |
| Latvians | 100.0 /100 | #35 | Exceptional $115,957 |
| Immigrants | Switzerland | 100.0 /100 | #36 | Exceptional $115,934 |
| Maltese | 99.9 /100 | #37 | Exceptional $114,754 |
| Immigrants | Pakistan | 99.9 /100 | #38 | Exceptional $114,434 |
| Immigrants | Turkey | 99.9 /100 | #39 | Exceptional $114,407 |
| Cambodians | 99.9 /100 | #40 | Exceptional $114,342 |
| Immigrants | Lithuania | 99.9 /100 | #41 | Exceptional $114,336 |
| Estonians | 99.9 /100 | #42 | Exceptional $114,220 |
| Israelis | 99.9 /100 | #43 | Exceptional $114,186 |