Immigrants from West Indies vs Sioux Seniors Poverty Over the Age of 75
COMPARE
Immigrants from West Indies
Sioux
Seniors Poverty Over the Age of 75
Seniors Poverty Over the Age of 75 Comparison
Immigrants from West Indies
Sioux
15.8%
SENIORS POVERTY OVER THE AGE OF 75
0.0/ 100
METRIC RATING
307th/ 347
METRIC RANK
16.8%
SENIORS POVERTY OVER THE AGE OF 75
0.0/ 100
METRIC RATING
327th/ 347
METRIC RANK
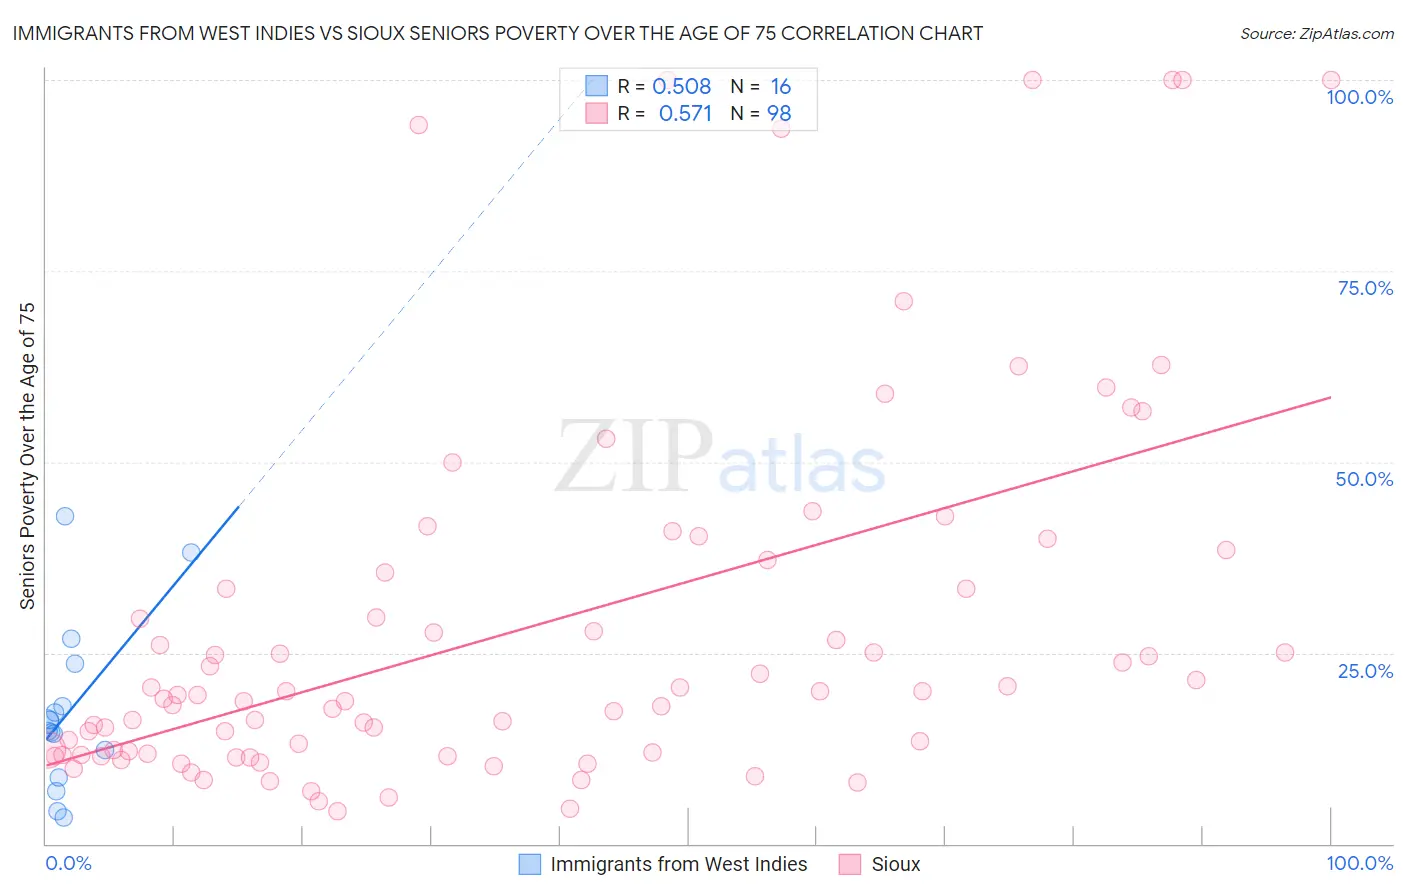
Immigrants from West Indies vs Sioux Seniors Poverty Over the Age of 75 Correlation Chart
The statistical analysis conducted on geographies consisting of 72,416,509 people shows a substantial positive correlation between the proportion of Immigrants from West Indies and poverty level among seniors over the age of 75 in the United States with a correlation coefficient (R) of 0.508 and weighted average of 15.8%. Similarly, the statistical analysis conducted on geographies consisting of 232,175,600 people shows a substantial positive correlation between the proportion of Sioux and poverty level among seniors over the age of 75 in the United States with a correlation coefficient (R) of 0.571 and weighted average of 16.8%, a difference of 6.2%.
Seniors Poverty Over the Age of 75 Correlation Summary
| Measurement | Immigrants from West Indies | Sioux |
| Minimum | 3.5% | 4.2% |
| Maximum | 42.8% | 100.0% |
| Range | 39.3% | 95.8% |
| Mean | 17.4% | 28.3% |
| Median | 15.4% | 19.5% |
| Interquartile 25% (IQ1) | 10.5% | 11.8% |
| Interquartile 75% (IQ3) | 20.8% | 35.4% |
| Interquartile Range (IQR) | 10.3% | 23.6% |
| Standard Deviation (Sample) | 11.0% | 24.5% |
| Standard Deviation (Population) | 10.6% | 24.4% |
Demographics Similar to Immigrants from West Indies and Sioux by Seniors Poverty Over the Age of 75
In terms of seniors poverty over the age of 75, the demographic groups most similar to Immigrants from West Indies are Immigrants from Bangladesh (15.8%, a difference of 0.040%), Yup'ik (15.8%, a difference of 0.34%), Vietnamese (15.9%, a difference of 0.44%), Trinidadian and Tobagonian (15.9%, a difference of 0.55%), and Crow (15.9%, a difference of 0.95%). Similarly, the demographic groups most similar to Sioux are Pueblo (16.7%, a difference of 0.21%), Nicaraguan (16.6%, a difference of 0.91%), Immigrants from Uzbekistan (16.5%, a difference of 1.3%), Central American Indian (16.5%, a difference of 1.3%), and Immigrants from Barbados (16.5%, a difference of 1.4%).
| Demographics | Rating | Rank | Seniors Poverty Over the Age of 75 |
| Immigrants | West Indies | 0.0 /100 | #307 | Tragic 15.8% |
| Immigrants | Bangladesh | 0.0 /100 | #308 | Tragic 15.8% |
| Yup'ik | 0.0 /100 | #309 | Tragic 15.8% |
| Vietnamese | 0.0 /100 | #310 | Tragic 15.9% |
| Trinidadians and Tobagonians | 0.0 /100 | #311 | Tragic 15.9% |
| Crow | 0.0 /100 | #312 | Tragic 15.9% |
| Barbadians | 0.0 /100 | #313 | Tragic 16.0% |
| Tsimshian | 0.0 /100 | #314 | Tragic 16.1% |
| Guyanese | 0.0 /100 | #315 | Tragic 16.1% |
| Immigrants | Ecuador | 0.0 /100 | #316 | Tragic 16.1% |
| Immigrants | Guyana | 0.0 /100 | #317 | Tragic 16.2% |
| Houma | 0.0 /100 | #318 | Tragic 16.2% |
| Haitians | 0.0 /100 | #319 | Tragic 16.2% |
| Immigrants | Yemen | 0.0 /100 | #320 | Tragic 16.5% |
| Immigrants | Haiti | 0.0 /100 | #321 | Tragic 16.5% |
| Immigrants | Barbados | 0.0 /100 | #322 | Tragic 16.5% |
| Central American Indians | 0.0 /100 | #323 | Tragic 16.5% |
| Immigrants | Uzbekistan | 0.0 /100 | #324 | Tragic 16.5% |
| Nicaraguans | 0.0 /100 | #325 | Tragic 16.6% |
| Pueblo | 0.0 /100 | #326 | Tragic 16.7% |
| Sioux | 0.0 /100 | #327 | Tragic 16.8% |