Immigrants from Venezuela vs White/Caucasian Male Unemployment
COMPARE
Immigrants from Venezuela
White/Caucasian
Male Unemployment
Male Unemployment Comparison
Immigrants from Venezuela
Whites/Caucasians
4.4%
MALE UNEMPLOYMENT
100.0/ 100
METRIC RATING
4th/ 347
METRIC RANK
5.0%
MALE UNEMPLOYMENT
97.3/ 100
METRIC RATING
70th/ 347
METRIC RANK
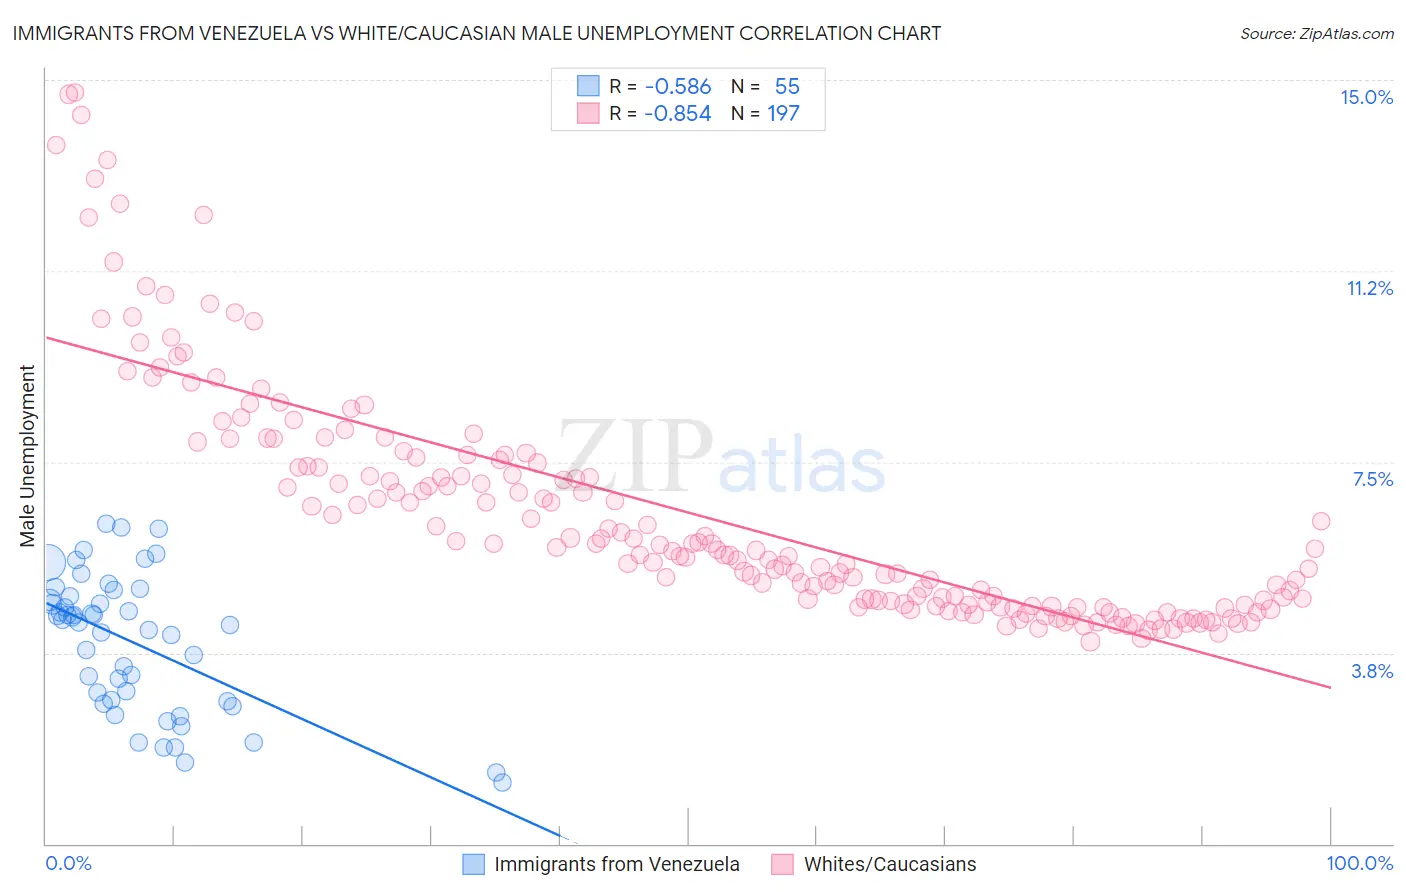
Immigrants from Venezuela vs White/Caucasian Male Unemployment Correlation Chart
The statistical analysis conducted on geographies consisting of 287,397,885 people shows a substantial negative correlation between the proportion of Immigrants from Venezuela and unemployment rate among males in the United States with a correlation coefficient (R) of -0.586 and weighted average of 4.4%. Similarly, the statistical analysis conducted on geographies consisting of 569,852,701 people shows a very strong negative correlation between the proportion of Whites/Caucasians and unemployment rate among males in the United States with a correlation coefficient (R) of -0.854 and weighted average of 5.0%, a difference of 12.8%.
Male Unemployment Correlation Summary
| Measurement | Immigrants from Venezuela | White/Caucasian |
| Minimum | 1.2% | 4.0% |
| Maximum | 6.3% | 14.7% |
| Range | 5.1% | 10.8% |
| Mean | 3.9% | 6.5% |
| Median | 4.3% | 5.8% |
| Interquartile 25% (IQ1) | 2.8% | 4.7% |
| Interquartile 75% (IQ3) | 4.9% | 7.4% |
| Interquartile Range (IQR) | 2.1% | 2.7% |
| Standard Deviation (Sample) | 1.3% | 2.3% |
| Standard Deviation (Population) | 1.3% | 2.3% |
Similar Demographics by Male Unemployment
Demographics Similar to Immigrants from Venezuela by Male Unemployment
In terms of male unemployment, the demographic groups most similar to Immigrants from Venezuela are Norwegian (4.4%, a difference of 0.33%), Immigrants from Cuba (4.4%, a difference of 0.58%), Danish (4.5%, a difference of 1.0%), Venezuelan (4.5%, a difference of 1.5%), and Immigrants from India (4.4%, a difference of 1.7%).
| Demographics | Rating | Rank | Male Unemployment |
| Immigrants | India | 100.0 /100 | #1 | Exceptional 4.4% |
| Immigrants | Cuba | 100.0 /100 | #2 | Exceptional 4.4% |
| Norwegians | 100.0 /100 | #3 | Exceptional 4.4% |
| Immigrants | Venezuela | 100.0 /100 | #4 | Exceptional 4.4% |
| Danes | 100.0 /100 | #5 | Exceptional 4.5% |
| Venezuelans | 100.0 /100 | #6 | Exceptional 4.5% |
| Czechs | 100.0 /100 | #7 | Exceptional 4.5% |
| Luxembourgers | 100.0 /100 | #8 | Exceptional 4.5% |
| Thais | 100.0 /100 | #9 | Exceptional 4.6% |
| Cubans | 100.0 /100 | #10 | Exceptional 4.6% |
| Swedes | 100.0 /100 | #11 | Exceptional 4.6% |
| Immigrants | Bolivia | 100.0 /100 | #12 | Exceptional 4.7% |
| Bolivians | 100.0 /100 | #13 | Exceptional 4.7% |
| Germans | 100.0 /100 | #14 | Exceptional 4.7% |
| Scandinavians | 100.0 /100 | #15 | Exceptional 4.7% |
Demographics Similar to Whites/Caucasians by Male Unemployment
In terms of male unemployment, the demographic groups most similar to Whites/Caucasians are New Zealander (5.0%, a difference of 0.020%), Immigrants from Sweden (5.0%, a difference of 0.050%), Australian (5.0%, a difference of 0.080%), Immigrants from Canada (5.0%, a difference of 0.090%), and Immigrants from South Africa (5.0%, a difference of 0.090%).
| Demographics | Rating | Rank | Male Unemployment |
| Eastern Europeans | 97.9 /100 | #63 | Exceptional 5.0% |
| Celtics | 97.8 /100 | #64 | Exceptional 5.0% |
| Icelanders | 97.6 /100 | #65 | Exceptional 5.0% |
| Finns | 97.5 /100 | #66 | Exceptional 5.0% |
| Immigrants | Canada | 97.5 /100 | #67 | Exceptional 5.0% |
| Australians | 97.4 /100 | #68 | Exceptional 5.0% |
| Immigrants | Sweden | 97.4 /100 | #69 | Exceptional 5.0% |
| Whites/Caucasians | 97.3 /100 | #70 | Exceptional 5.0% |
| New Zealanders | 97.3 /100 | #71 | Exceptional 5.0% |
| Immigrants | South Africa | 97.1 /100 | #72 | Exceptional 5.0% |
| Greeks | 97.0 /100 | #73 | Exceptional 5.0% |
| Immigrants | North America | 96.9 /100 | #74 | Exceptional 5.0% |
| Assyrians/Chaldeans/Syriacs | 96.9 /100 | #75 | Exceptional 5.0% |
| Immigrants | Sudan | 96.5 /100 | #76 | Exceptional 5.0% |
| Iranians | 96.4 /100 | #77 | Exceptional 5.0% |